
Diagram Tool Introduction
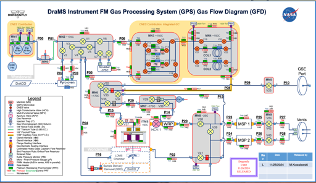
The Diagram Tool allows images to be "animated" based on data in XINA. Typically this is used to view the DraMS Gas Processing System. But any image that can be saved an "SVG" file can setup to be animated. (See below for instructions to make PowerPoint slides into SVG files)
The Diagram Tool is actually 3 tools.
- Diagram Viewer -- Open an existing diagram and select a set of data to animate it
- Diagram Editor -- Create and edit an existing diagram
- Diagram Simulator -- Create scripts to simulate the data
from an instrumentand view in the diagram