
Dashboard Getting Started
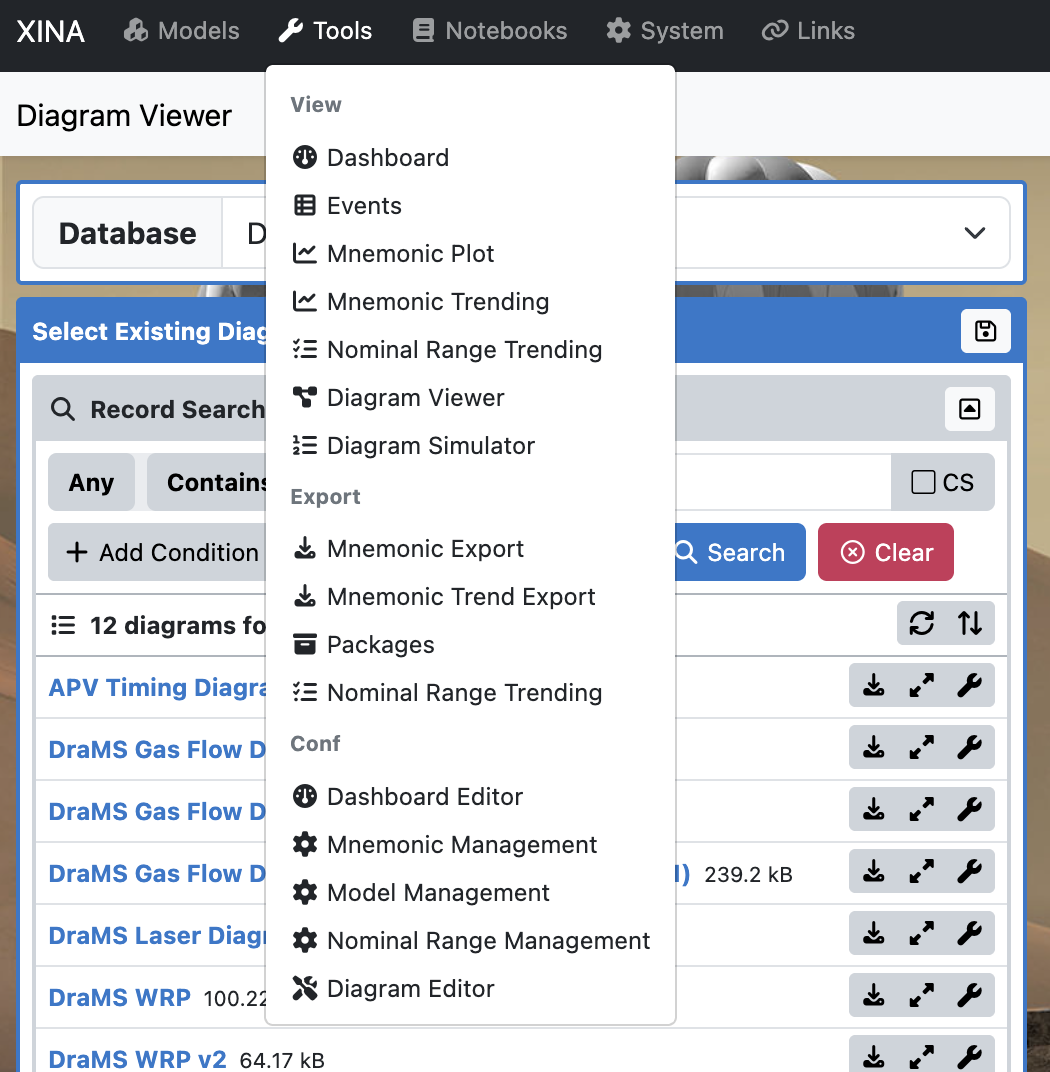
https://drams.xina.io has several “tools”. Tools can be select from the Tools menu in the main XINA window. However, URLs can be used to jump directly to particular tools. More on that later. The image below shows the tools menu which can be reached from any XINA screen.
Dashboard How-To
The Dashboard has two different XINA tool, the ''Dashboard'' (top of the menu) and the ''Dashboard Editor'' (near the bottom).
The ''Dashboard'' allows you to select from predefined groups of mnemonics by name, such as “WRP” or “MSP1”.
The ''Dashboard Editor'' allows you to create a new predefined group (referred to as a “Configuration”) of mnemonics or edit an existing group.
The starting ''Dashboard'' view looks like this (you might see something slightly different):
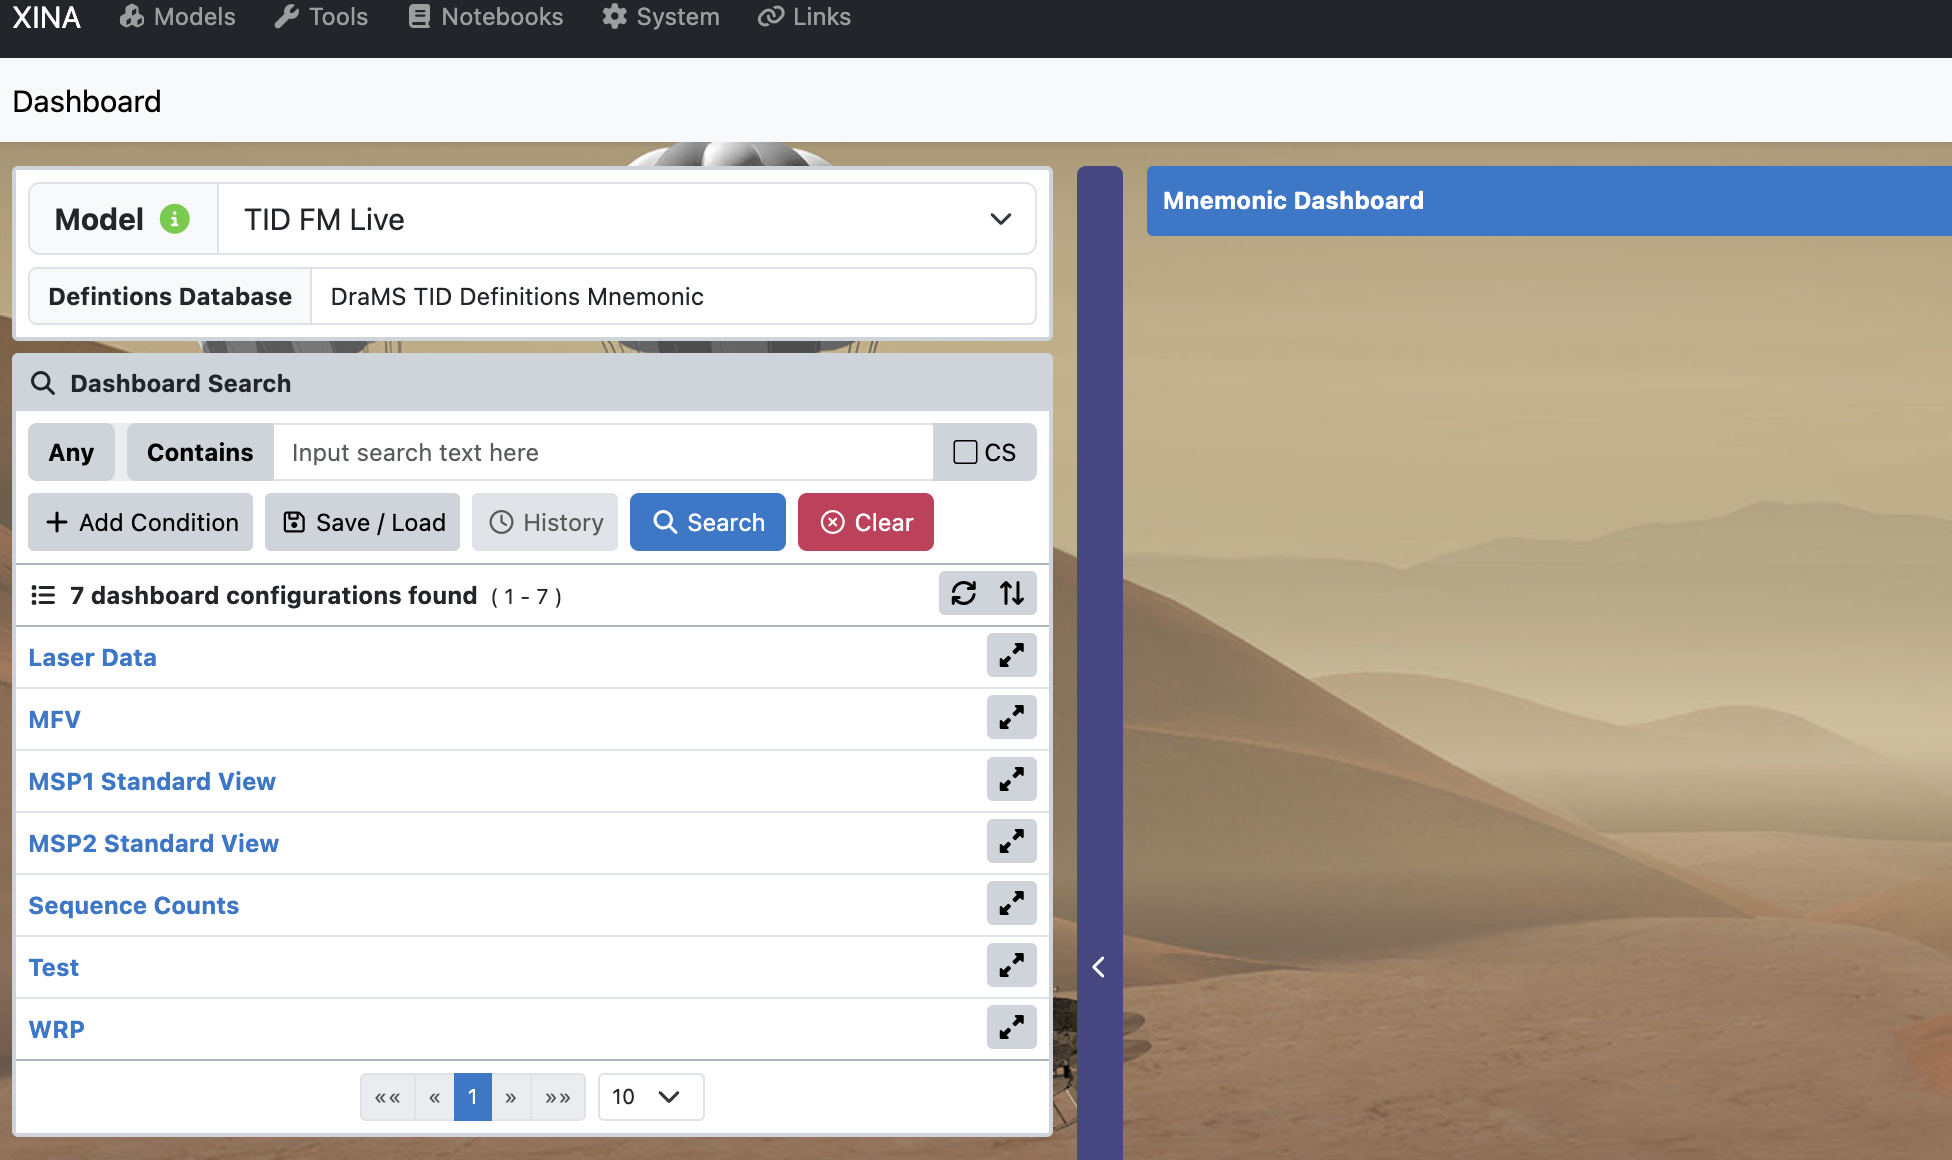
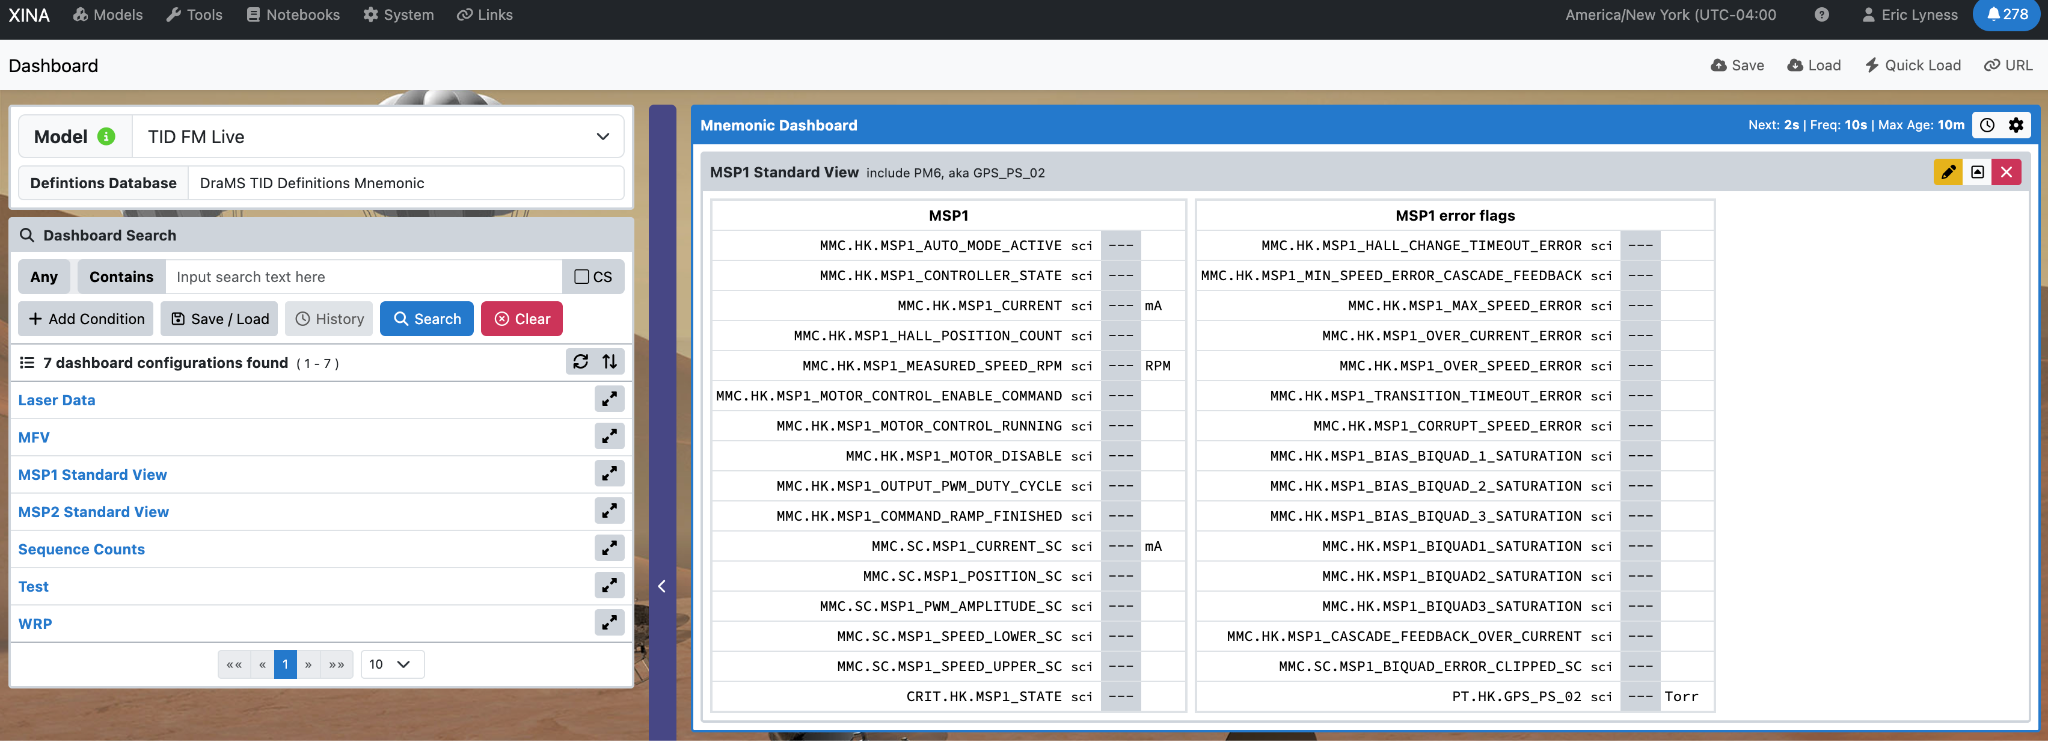
The blue text on the lower left are the names of predefined collections of mnemonics. Clicking one of them will show the table of values. Clicking on “MSP1 Standard View” leads to this view:
Clicking on another configuration will add a table to the view:
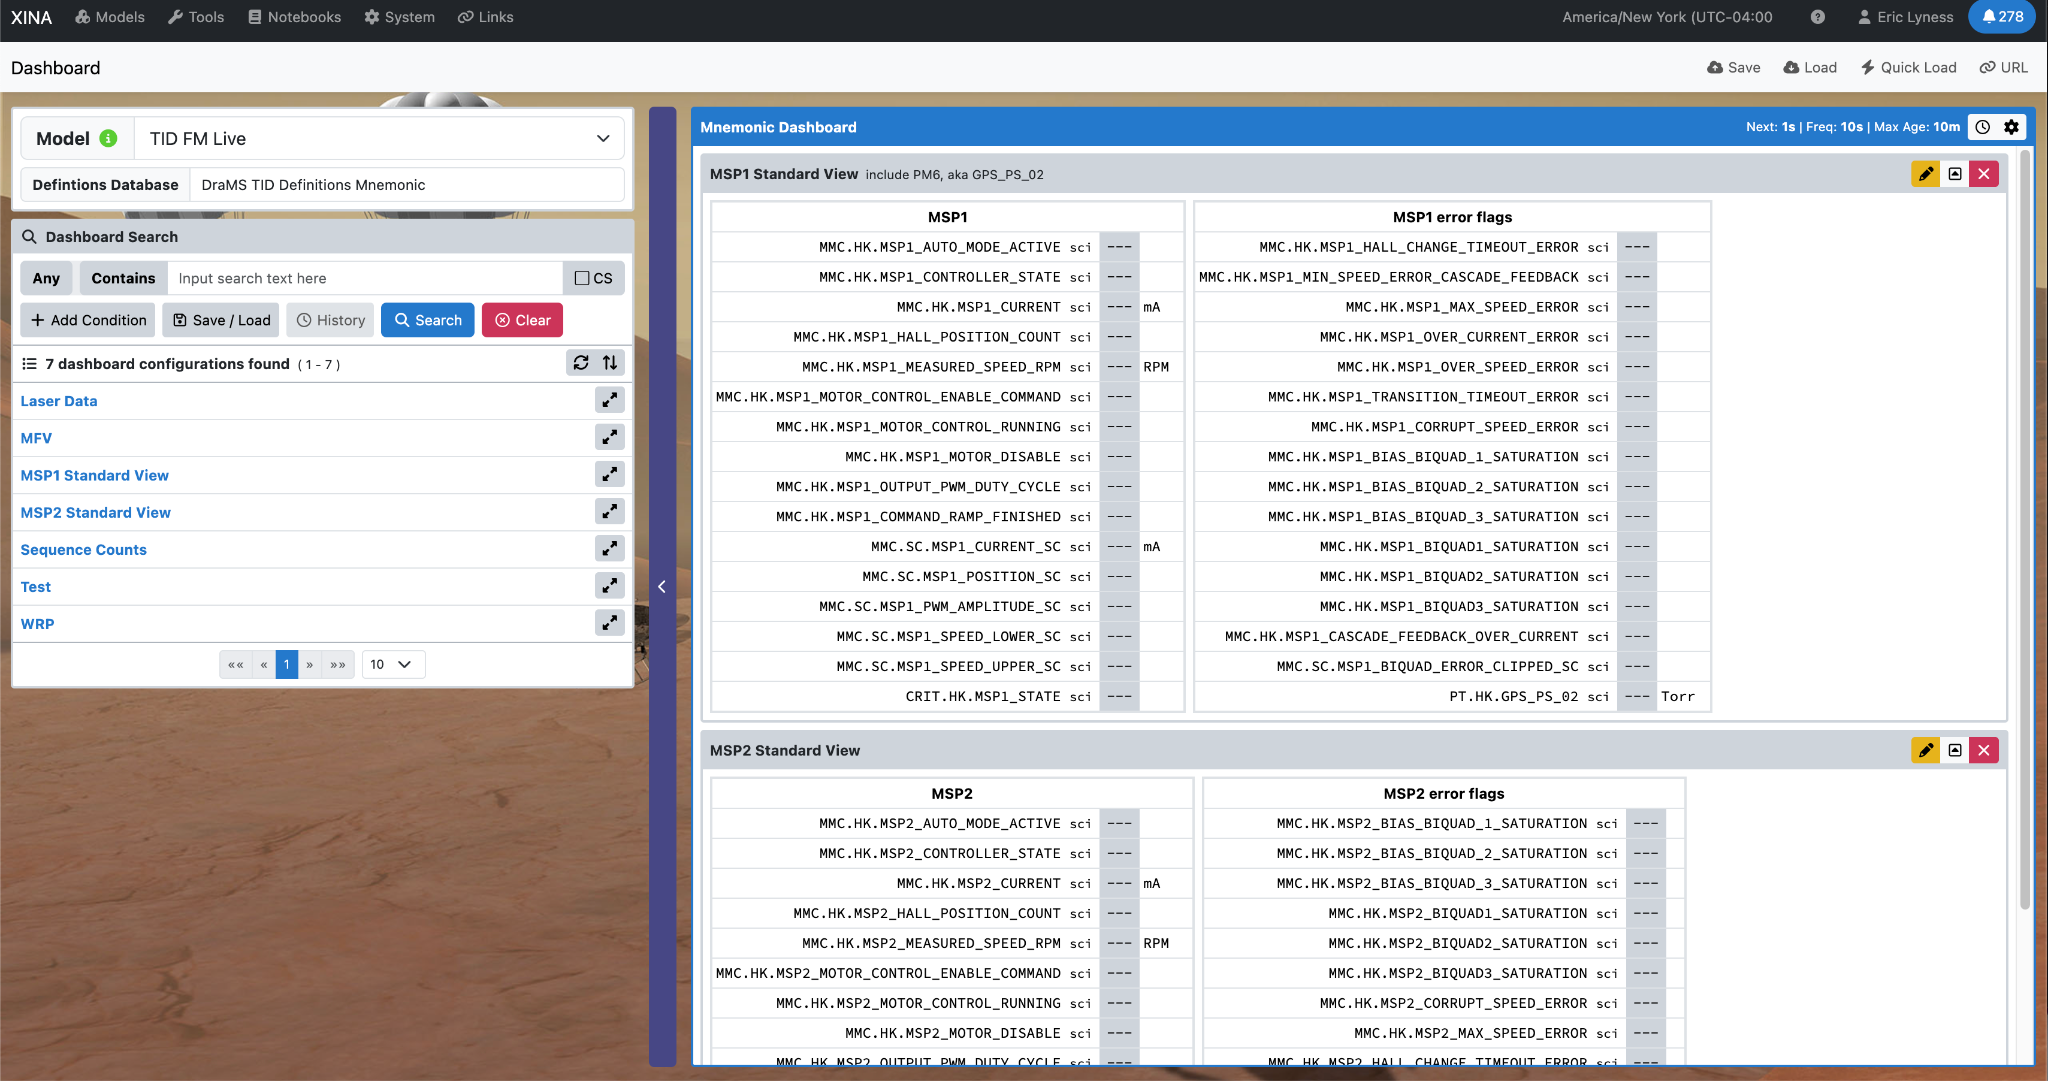
Each mnemonic can have green, red and yellow ranges defined in XINA. If the mnemonic’s value falls into one of those ranges, the background of the numbers in the table will change to the corresponding color.
= Making URLs and Bookmarks =
Your dashboard view can be remembered in XINA and you can save a URL to the dashboard as a bookmark in your browser so that you can very quickly get back to seeing the data.
In the upper right corner of the Dashboard you will see the “Save” and “Load” buttons.
[[File:media/image3.png|246x149px]]
Clicking save will bring out this view:
[[File:media/image8.png|1186x560px]]
Give the dashboard a descriptive name so you can easily find it in a search. There might be many dashboards later. If this is one you use all the time, click “Bookmark” and it will always appear at the top of the search list. Click “Recommend” and other people will also see it at the top of their lists.
Once you’ve saved the Dashboard, you can load it by clicking the “Load” bottom in the top right. You should see something like this:
[[File:media/image10.png|296x176px]]
Clicking on the blue words, like “Scroll Pump Live” will load the Dashboard view. Notice the set of tools to the right of the name:
[[File:media/image13.png|408x64px]]
The 4th icon, that looks like a chain link, allows you to create a URL directly to the saved view:
[[File:media/image4.png|1196x204px]]
You can copy the link to the clipboard then in your browser, create a new Bookmark and add it to your Bookmarks bar, or wherever is convenient.
The other icons in the row above:
[[File:media/image6.png|36x33px]] Make this one of your favorites so it always shows up at the top of your list.
[[File:media/image9.png|37x34px]]Recommend this configuration to everyone (it will show up below their favorites)
= Creating Custom Dashboards =
[https://drams.xina.io/tool/dashboard-editor https://drams.xina.io/tool/dashboard-editor]
Use the '''Dashboard Editor''' to create dashboard configs that will appear in the Dashboard view shown above.
[[File:media/image15.png|331x371px]]
The top item in the view [[File:media/image1.png|69x26px]]is important. It determines the database from which the data will come. For the dashboard, always use “TID FM Live”. (other models might be used for specific purposes not covered here).
Also leave the "Definitions Database” as is.