Dashboard Introduction
https://drams.xina.io/tool/dashboard
The '''Dashboard''' display was created to display mnemonics in high density format:
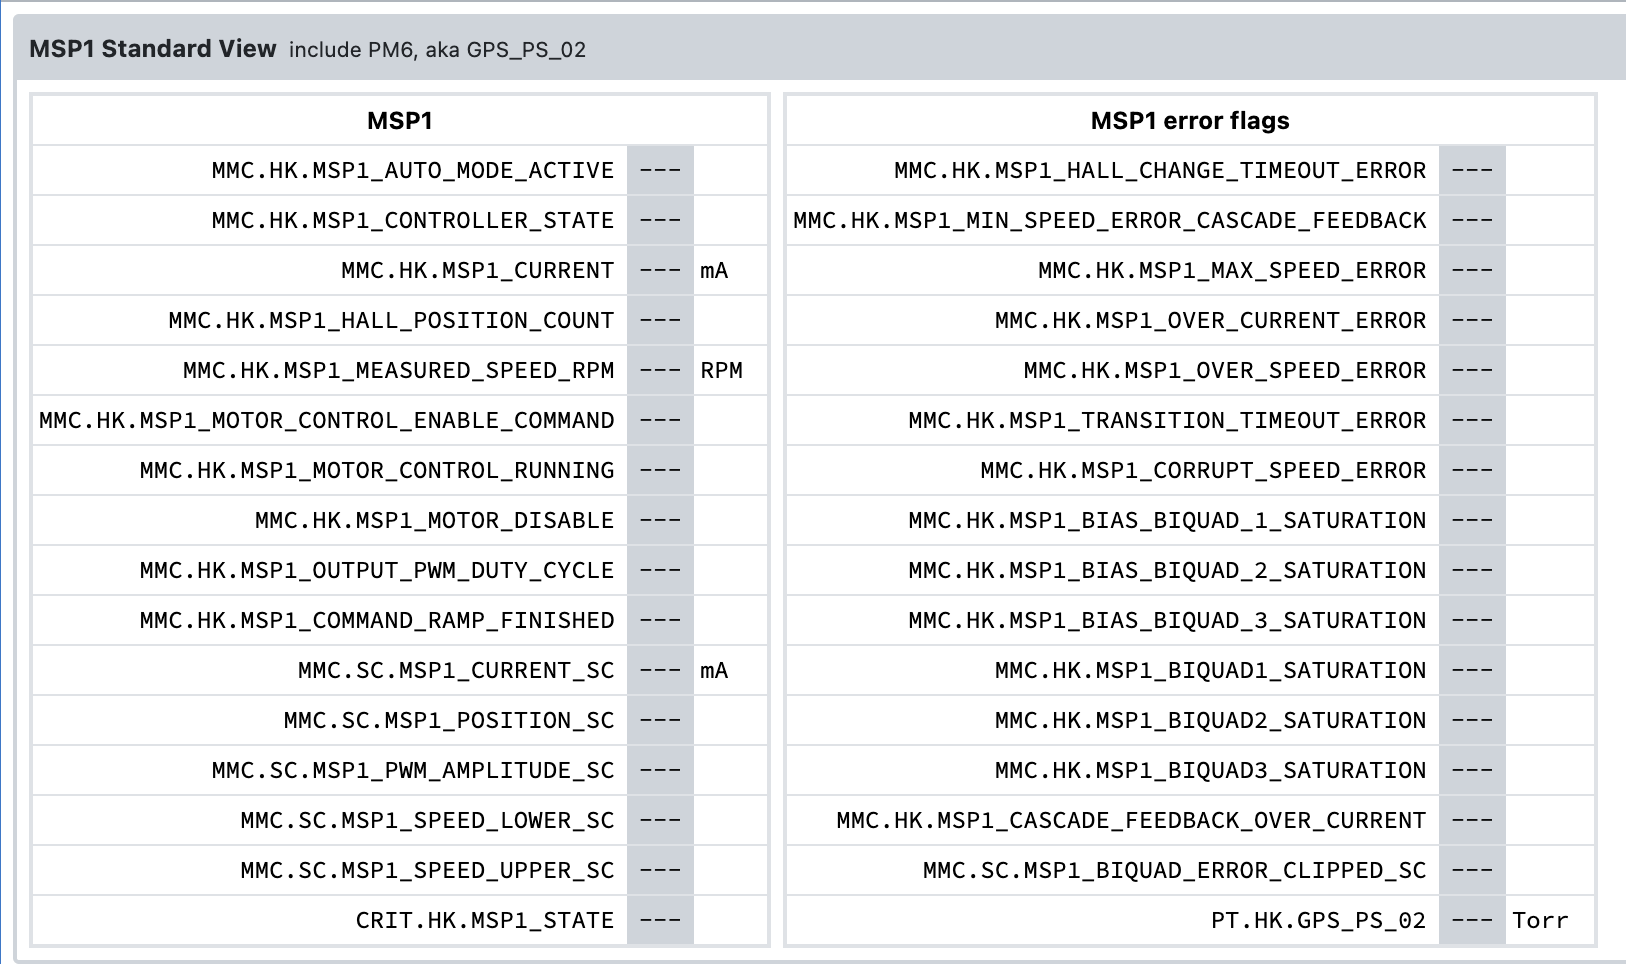
Dashboards canwere bedesigned configuredaround tolooking haveat anydata numberlive of-- rowsas andit columnsis containing any DraMS mnemonics.generated. When data is flowing live, these values will update about every 10 seconds with about a 10 second delay from when they were transmitted out of the instrument. The value displaydisplayed is the most recent value.
Dashboards can be configured to have any number of rows and columns containing any DraMS mnemonics.
The '''Mnemonic Plot''' tool can be used to plot live data. It can show any combination of mnemonics in a graph as data over time:
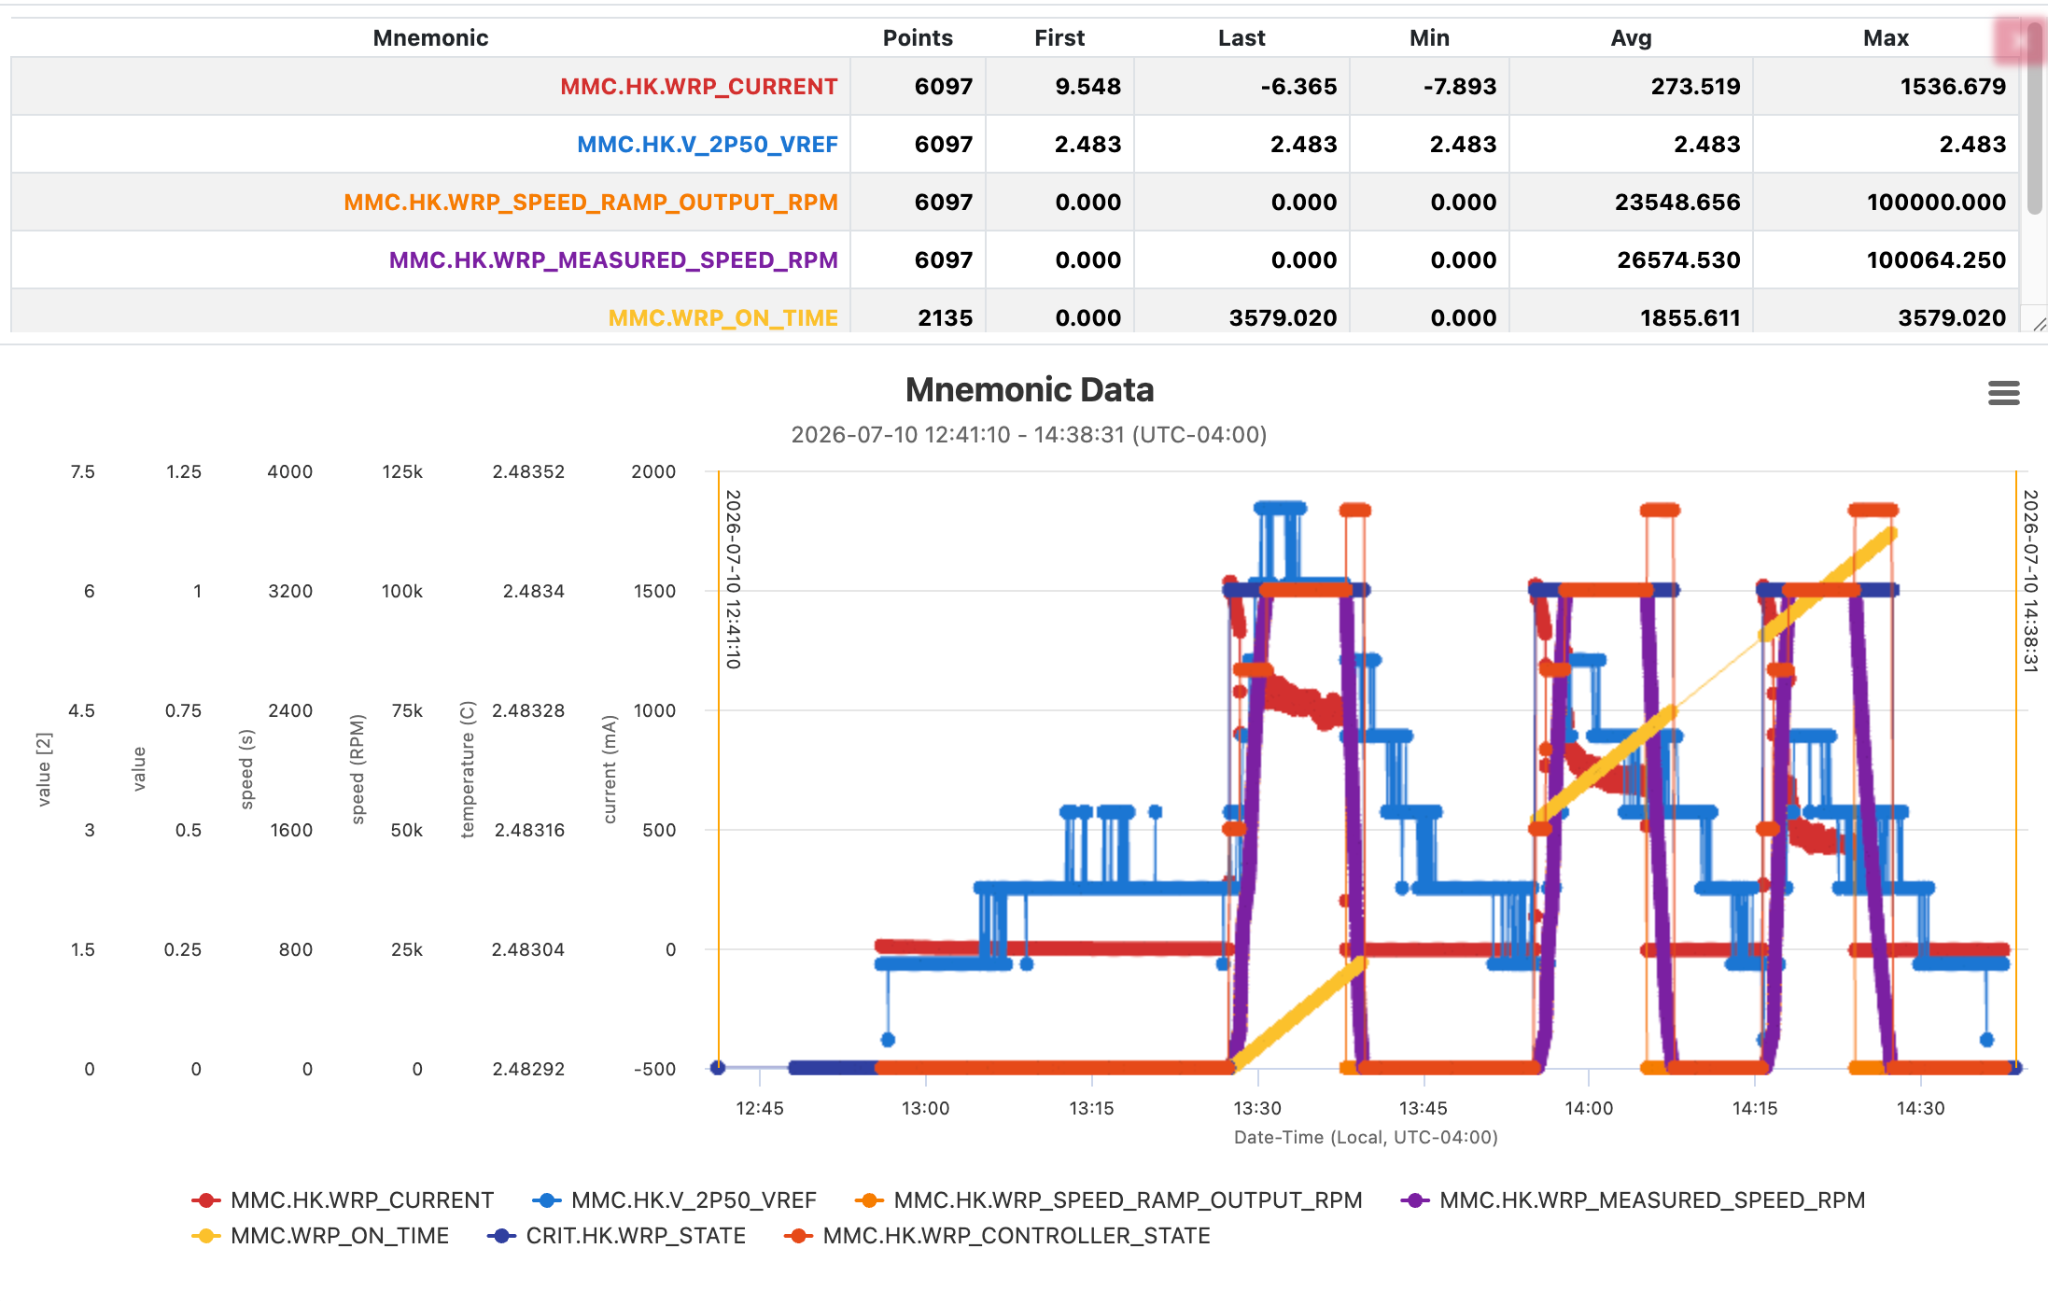
The Mnemonic Plot tool can be configured to update live every 10 seconds like the Dashboard. However, it will plot all the intermediate values that were collected in the last 10 seconds. The Menmonic plot tool can also be used to look at data from any arbitrary date and time range.
https://drams.xina.io/tool/diagram
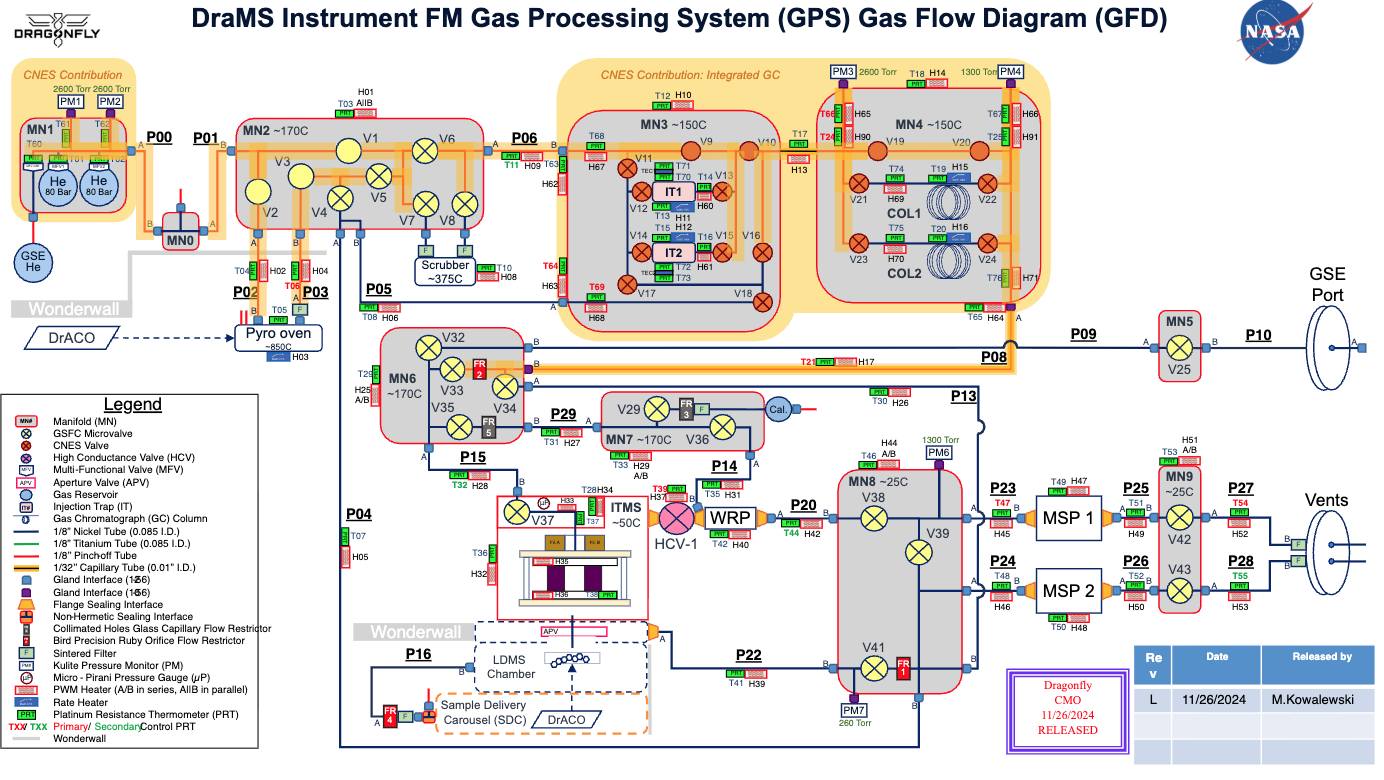
The '''Diagram Tool''' uses the telemetry to update an SVG diagram of the DraMS gas processing system.