OCI Step-by-step Instructions
Step-by-step instructions to use the Data Viewer for various OCI tests
- ADC Sweep
- Touch Sensitivity Test
- ADC Output Phase Tuning
- RG Sweeps
- EMI Testing
- DDC Raw Capture
- DDC Scope Capture
ADC Sweep
This page contains instructions on how to view the ADC Sweep data with the DDC Raw Viewer.
The ADC sweep is performed by capturing multiple DDC raw captures while stepping the ADC sample point, which is a combination of the ADC mux delay (fine steps) and ADC Clock offset (coarse steps). One or more DDC Raw Captures may be collected at each step, depending on how the ITOS proc is configured. The collection of all steps is an "ADC Sweep".
Setup
- Open the DDC Raw Viewer (bring to front an existing one or open a new one)
- Set the
CCD ID - Start ADC Sweep ITOS procedure
- The viewer will update when a complete DDC raw capture is received. A single raw capture may look something like:


The colored regions indicate the different parts of a "line". Each raw capture contains ~11 lines of data (dependent on various OCI settings). The "INFO" annotation indicates the start of a raw capture.
Sweep Finished
When the ADC Sweep is finished, you may see something like below. (The actual shape may vary depending on the environment and other variables)

Scroll down to view the charts titled ADC Tap and CDS SD Tap. These are the main charts we will be using to analyze the ADC Sweep data.
The ADC Tap chart displays the ADC Counts vs. ADC Sample Point, where ADC Sample Point (x-axis) is defined as:
ADC Sample Point = (ADC Clock Offset * 48) + Mux Delay
The ADC Clock Offset is also known as the coarse setting, Mux Delay as the fine setting.
The CDS SD Tap chart displays the standard deviation of the calculated CDS for the image pixels (green region) of the 11 lines per capture.
If no data is visible, you may need to rescale the chart. You can do this 1 of 3 ways: double click on the chart, right click and select "Reset zoom", or click on the number at the top right corner of the chart.
Below are a few other notes:
- There is one ADC Tap and CDS SD Tap chart per tap.
- You may uncheck the
Per Tap Vid/Ressetting to hide the leftmost chart - The
Sync Axessetting will keep all of the chart axis ranges in sync. If you wish to control each chart separately, set this toNone. - If you wish to auto scale the y-axes, check
y auto. This will immediately rescale the y-axes, and to any new data that arrives. A common trick is to check and then uncheck to immediately rescale all of the y-axes. Note that even withy autochecked, theSync Axessetting is still enforced which may cause unexpected behavior.
At the end of the ADC Sweep, you may see something like this:

The ADC Tap charts are used to determine the ADC sample point settings we want to use. How this decision is made is outside the scope of these instructions.
You may see a jump/discontinuity in the chart when going to the next coarse setting. This occurs because the actual timing delay is not continuous, but we treat and display the ADC sample point as continuous. In the below chart, you can see discontinuities at x=48 and x=96, which is where the coarse setting is incremented. This should be kept in mind when determining what sample point to use.

Exporting
- To export all of the ADC Tap charts as a single image, click the Export ADC Charts button.
- To export all of the CDS SD Tap charts as a single image, click the Export CDS SD Charts button.
- Each raw capture is automatically exported to disk. You can the export path in the status bar at the bottom of the window. Each raw capture is written to a single file. A corresponding hk file is exported containing relevant telemetry data for the raw capture. Unfortunately, we do not automatically group all of the raw captures for a complete ADC Sweep. You can determine this manually by using the timestamp in the filename. Zip up all relevant files for the ADC Sweep if further analysis is required.
Touch Sensitivity Test
This page contains instructions on how to use the Data Viewer during the touch sensitivity tests.
Setup
- Open 2 instances of the Stats Per Pixel vs. Time viewer. (or bring to front if already open)
- Set the
Stats Modeon one toSDand the other toAVG. Note: The window title displays theStat Modewhich can be used to differntiate the 2 instances. - For both configure the following settings:
-
Subtrack Dark:None -
HAM Side:Both -
Lines mode:All -
time win[s]:120 (or something reasonable)
Optional:
-
y-auto:check if you want the y-axis to auto scale to new data -
Sync Axes:If enabled, the axes across the charts will be kept in sync -
Series Names:Switch between pixel number and wavelength
Real-time operations:
- Click the Pause button if you want to stop auto-scrolling the x-axis to new data
- Click the Go Live button to resume auto-scrolling the x-axis to new data
- Set the
time win[s]to 0 to scale the x-axis to all data - If you zoom in on a chart, the x-axis auto-scrolling will be disabled if the most recent data is no longer visible on the chart. You can resume auto-scrolling by resetting the zoom or clicking the Go Live button.
No data?
The charts may need to be properly scaled. Double click to zoom out, or right click and select "Reset Zoom".
Exporting
You can export the charts as a single image by clicking on the Snap button.
Examples


ADC Output Phase Tuning
RG Sweeps
These instructions are for the Rg Mag and Rg Low sweeps.
EMI Testing
These instructions detail how to use the data viewer during EMI testing.
- Update to get the newest EMI window config
- Open a terminal
-
cd ocigse -
git pull - Close terminal
- On the bottom menu bar, click on
ocidataviewand select theOCI Data Viewerwindow.

-
At the top of this window is a menu bar. Select
Setup->Restore Windows -
Select
emiand click OK. This will load the 'emi' window configuration and may take up to a minute to reload the cached data. -
You can switch between the open viewers by clicking on the
ocidataviewin the menu bar and then selecting a viewer from the list. -
The 4 main viewers you will be using are:
- SSM Ch Stats vs. Time - AVG - Displays AVG counts for the whole scan per SSM channel.
- SSM Ch Stats vs. Time - SD - Displays SD for the whole scan per SSM channel.
- Stats Per Pixel vs. Time - AVG - Displays AVG counts for the whole scan per FPA pixel.
- Stats Per Pixel vs. Time - SD - Displays SD for the whole scan per FPA pixel.
Susceptibilities are more apparent in the SD variants; below is an example of what this may look like:
``
DDC Raw Capture
Instructions to generate DDC Raw Capture images:
- File -> Open Archives -> Select archives to open. You may select more than one.
- Open DDC Raw viewer if not already open: Data Viewers -> DDC Raw
- Maximize the window
- Set settings on the right side:
- CCD ID: Red or BLUE
- Chart Height: 500
- Sync Axes: Both
- Show Regions: checked
- Line Window: 1
- Right click the "All Taps Video" chart's y-axis, set range [14500, 16500]
- Right click the "All Taps CDS" chart's y-axis, set range [-50, 500]
- If desired, right click on each chart and select "All series data points visible"
- All other settings can be left at the defaults
- Capture screenshot of whole window, except stop before the "All Taps Raw Samples" chart. Include the settings area on the right side.
- Repeat as needed for RED/BLUE
Below is an example screenshot:
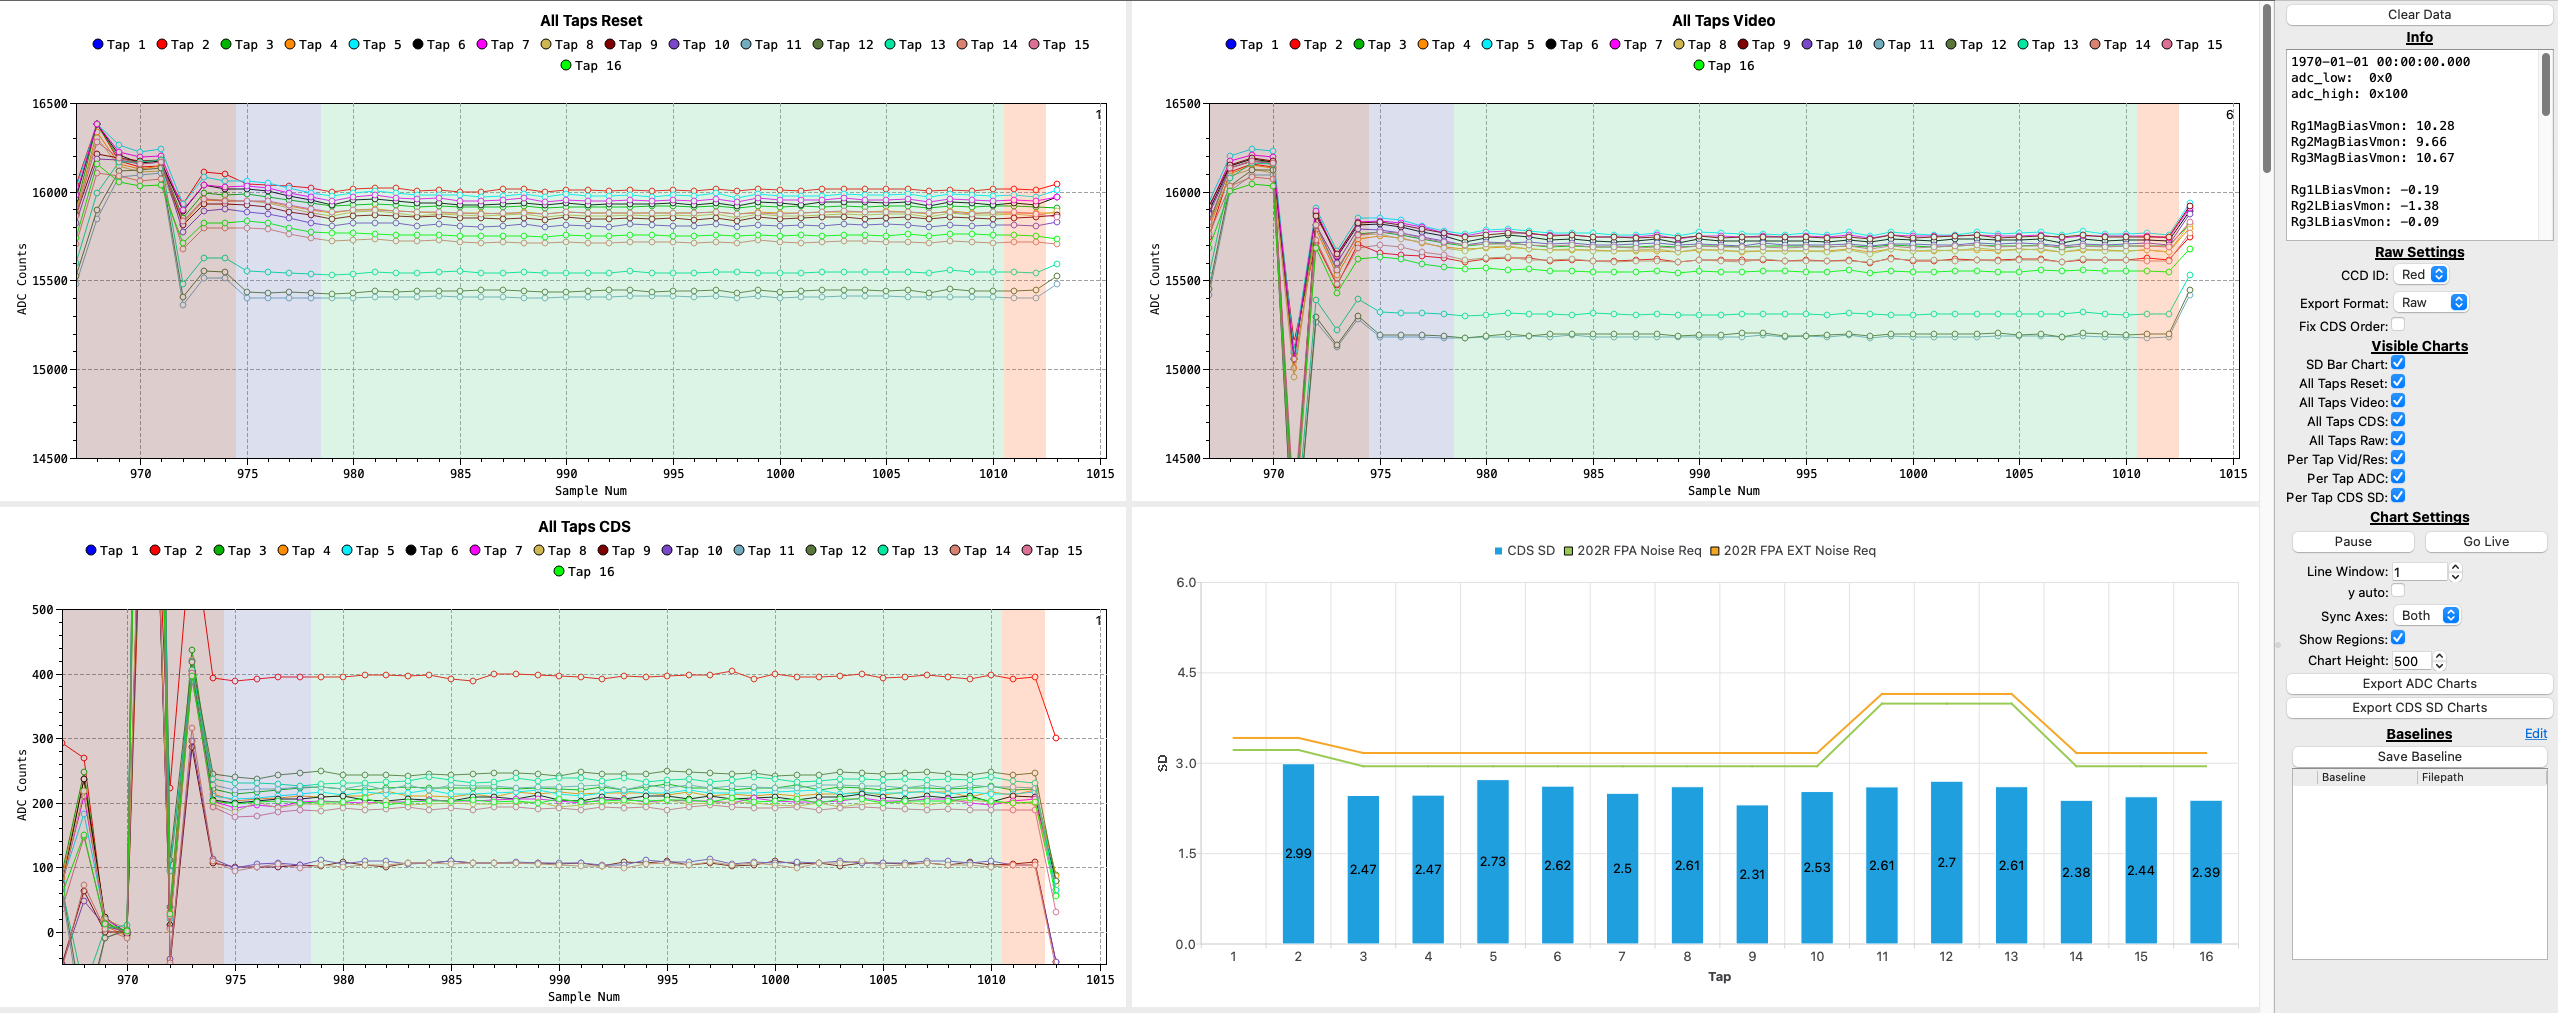
DDC Scope Capture
The DDC Scope Mode Viewer is used to view and export the collected DDC Scope Capture data.
- File -> Open Archives -> Select archives to open. You may select more than one.
- Open DDC Scope Mode viewer if not already open: Data Viewers -> DDC Scope Mode
- Maximize the window
- Any scope captures will be parsed and loaded into the "Capture List"
- Under "Export Settings":
- If "Auto Export Raw CSV" is checked, the raw data will be auto exported to a CSV into ~/ocidata/scope_captures/
- If "Auto Export Retimed CSV" is checked, the retimed data will be auto exported to a CSV into ~/ocidata/scope_captures/
- If "Auto Export Charts" is checked, chart images will be automatically generated to ~/ocidata/scope_captures. The y-axis for these images are scaled for dark data. For light images, you will need to manually adjust the images and then click "Export Charts".
- The auto exported images are usually good enough for our functional tests. However, for special tests, such as performing scope captures with light, you will need to manually adjust the y-axis and export the charts by clicking "Export Charts".