OCI User Guide
- Export Plot configuration: JSON Format
- Filtering Data
- Filters
- View and download generated reports (aka packages)
- Export process
- Reprocessing Data
- Exporting Data
- OCI HK Merge Utility
- Add users to daily reports
- Configure Export Plots
- Configure Trend Reports
Export Plot configuration: JSON Format
We use matplotlib v3.1.3 for our plot generation. The plot report is configured using JSON. The top level global applies global configuration. It currently supports a limited subset of the rcParams: font_size, font_family, agg_path_chunksize. Future versions will support all rcParams keys. The global["plot_options"] can be used to configure plot options for all series. This is convenient if you want to apply an option to all series without having to define it for each one.
plot_options can also be defined at the plots level, which will apply to each series within a plot, or at the series level, which will apply to a specific series. All plot_options (global, plot, and series) are merged together when plotting each series, with the series plot_options having the highest precedence, then plot, then global. The plot_options at any level supports all matplotlib Line2D properties.
You may define the plots_hspace as part of the page object to control horizontal spacing between all of the plots on a page. This can be used to control the spacing when there are overlap issues. We recommend starting with a value of 1, exporting a small amount of data, and then increasing or decreasing the value to achieve the desired results.
You may define the height_ratio as part of the plot object to control how much vertical space it takes up. Defaults to a value of 1.
Any option may be omitted entirely and a default value will be used.
Trend Series Options:
Since the Export Plot configs are also used/referenced by the Trend Exports, we support options that are only used by the Trend Export plot generation. These option can be defined at the top level or per series. The top level will apply to all series but the per series definition will override it.
The trend_series option can be defined to control which trend series are plotted. If not defined, then the min, avg, and max series will be plotted.
Example: "trend_series": ["min", "avg", "max"]. If you want to only plot the average series, use "trend_series": ["avg"].
The trend_line option can be defined to draw the trend line on the plot. A trend line will be drawn for each trend series. For example, if you are plotting a mnemonic's min, avg, max, then a trend line will be drawn for each series. If ommitted, then no trend line will be drawn. We currently only support "linear" to display the linear trend line.
Example: "trend_line": "linear"
Below is an example JSON plot config file. Note that pages and plots are JSON arrays which implies the generated pages and plots are ordered accordingly. Any comments are for descriptive purposes only; they are not allowed in the actual configs.
{
  "global": {
      "plot_options": {
        "linewidth": 0.3,
        "marker": "d",
        "markersize": 3
      },
      "font_size" : 10,
      "font_family" : "monospace",
      "agg_path_chunksize": 10000
  },
  // Define the trend series that will be plotted for each mnemonic. This can be omitted
  // and it will default to min, avg, max.
  "trend_series": ["min", "avg", "max"],
  // A linear trend line will be drawn for all series. If omitted, no trend line will be drawn.
  "trend_line": "linear",
  "pages": [
    {
      "plots": [
        {
          "title": "1st plot on page 1",
          "series": [
              {
                  "mnemonic": "oci.dau.boxrack.power.PS01.m1curoutp",
                  "plot_options": {"marker": "x"},
                  // Only plot the avg series for this mnemonic. This will override the top
                  // level "trend_series" option if it exists.
                  "trend_series": ["avg"],
                  // Display a linear trend line for this mnemonic.
                  "trend_line": "linear"
              }
          ],
          "plot_options": { "color": "red" },
          "y_min": -5,
          "y_max": 5
        }
      ]
    },
    {
      "plots_hspace": 1.2,
      "plots": [
        {
          "title": "2 plots on page 2",
          "height_ratio": 2,
          "series": [
            {
              "mnemonic": "oci.dau.dauc.Tlm.Red_BdTemp3",
              "plot_options": {
                "color": "r"
              }
            },
            {
              "mnemonic": "oci.dau.dauc.Tlm.Blue_BdTemp3",
              "plot_options": {
                "color": "b"
              }
            }
          ]
        },
        {
          "height_ratio": 1,
          "series": [
            {
              "mnemonic": "oci.dau.ddc.FPGA.CcdOpMode",
              "plot_options": {
                "color": "k"
              }
            }
          ]
        }
      ]
    }
  ]
}
Filtering Data
Filter Expressions
A filter expression is a Boolean Expression. A Boolean Expression can be any of the following:
-
<Boolean Expression> AND <Boolean Expression> -
<Boolean Expression> OR <Boolean Expression> -
<Boolean Expression> XOR <Boolean Expression> -
NOT(<Boolean Expression>) -
(<Boolean Expression>)
A Boolean Expression can also be the result of a comparison:
-
<Numerical Expression> == <Numerical Expression> -
<Numerical Expression> != <Numerical Expression> -
<Numerical Expression> > <Numerical Expression> -
<Numerical Expression> < <Numerical Expression> -
<Numerical Expression> >= <Numerical Expression> -
<Numerical Expression> <= <Numerical Expression>
A Numerical Expression can be any of the following:
-
<Numerical Expression> + <Numerical Expression> -
<Numerical Expression> - <Numerical Expression> -
<Numerical Expression> * <Numerical Expression> -
<Numerical Expression> / <Numerical Expression> -
<Numerical Expression> ^ <Numerical Expression> -
(<Numerical Expression>) -
<Identifier> -
<Number>
An Identifier should match the regular expression ([Pp]@)?:?[0-9a-zA-Z_"."]+. That is, it should be some combination of digits, letters, _, and ., optionally preceded by P@/p@ and/or :.
A Number may be in decimal or scientific notation, with a + or - for sign. Valid examples:
-
1 -
-1.2 -
.2 -
0.2E-20 -
+1.e+20
Standard order of operations is followed:
- Parentheses
- Exponent
- Multiplication and Division
- Addition and Subtraction
- Comparison (
==,!=,>,<,>=,<=) -
NOT -
AND -
XOR -
OR
Future Enhancements
Some of these features might be supported in future updates, if there is demand:
- Boolean literals
- Alternate forms of operators (e.g.
EQinstead of==) - Scientific vs non-scientific values
Examples
(:oci.dau.ddc.FPGA.FpgaVersion == 134402) AND (:oci.dau.ddc.FPGA.PktsGen >= :oci.dau.ddc.FPGA.PktsSent) OR (:oci.dau.ddc.FPGA.BlueLoAdcLat^2 == 256)
Filters
Mining
- all filter definitions are passsed to the oci_extract_hk_data, and it generates full/delta, time bin, and marker binned filtered data. The filtered data output files are associated with each filter definition ID
- This filtered data can be used to plot filtered data through the OCI HK tool (full/delta and time binned)
- Generate filtered trend data
Exporting
- Filter definitions can be associated with a profile's
filterfield. The JSONfilterkey can use either the filter definition'sIDorname. If the filter definitions associated with a profile have mnemonics that overlap, the first filter (by JSON array index) will be applied and others are ignored (a warning message will be output by oci_extract_hk_data).
[
  {
    "filter": "om_visnir_on"
  },
  {
    "filter": "om_uvvis_on"
  },
  {
    "filter": "valid_dauc_tlm"
  }
]
- One off filters can be defined before exporting by inputting the filter condition into the "filter configuration" box. You can also define which HKIDs the filter should be applied to. In the below example, because "hks" is not specified, the filter will be applied to all mnemonics. The ":" prefix in the mnemonic name is there for legacy reasons but may not be required in future versions.

Here is another example that specifies a list of HKIDs to apply the filter to:
[
  {
    "hks": "42314, 42316, 42318, 42319, 42320, 42321, 42322, 42332, 42333",
    "condition": ":oci.mce.rtaham.RotatingSynchronized == 1",
    "name": "MCE_SPINNING"
  }
]
View and download generated reports (aka packages)
Reports that have already been generated can be downloaded using the packages tool.
You can download the report by clicking on the text in the label column.
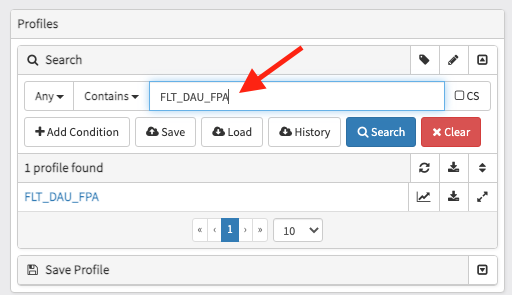
You can filter the packages using the top search bar. For example, in the below image we've filtered the packages for the FLT_DAU_FPA profile.

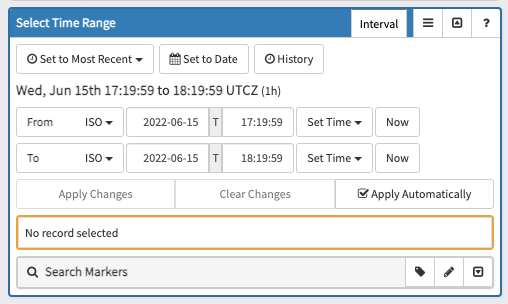
You can filter by time range using the Select Time Range box on the left side. By default all packages are displayed.

Export process
The OCI housekeeping export process runs asynchronously on the OCI Run server. Requested data is extracted directly from the original time slice telemetry files using the same application from the realtime data mining process. In order to correctly interpret state across time slice boundaries the process attempts to load the time slice prior to the slice containing the start of the exported data, if one is available, to establish the current value table and filter state files accurately for the data to be exported.
Reprocessing Data
Exporting Data

The last used Model is saved between sessions and tools
- Select your time range:
The time input uses your machine's timezone (which is likely eastern time for most users). However, the exported data and plots all use UTC.
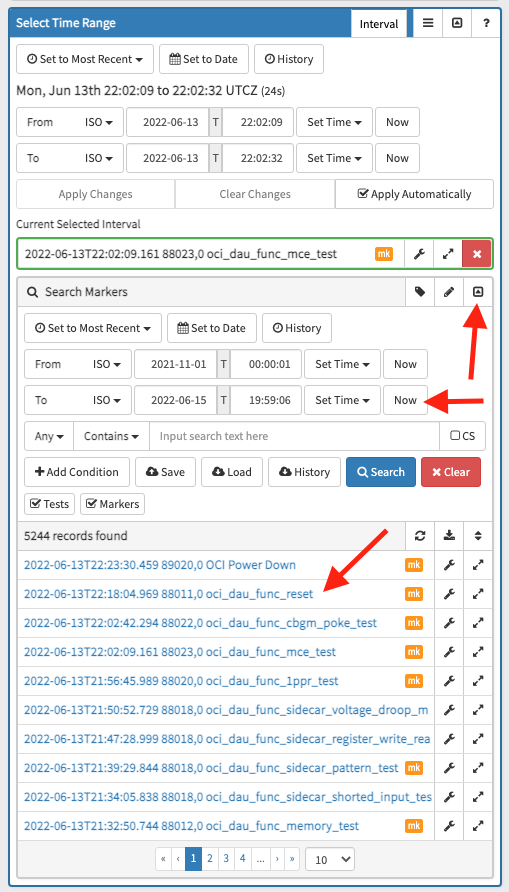
Instead of manually inputting a "From" and "To" time, you can also select a marker's time range. Click on the "down arrow" to expand the "Search Markers" panel. You can then click on the label to use the time range. To refresh the marker list for new markers, click the "Now" button, which will adjust the search "To" time to the current time.
- Filter by the profile you want to export, for example: FLT_DAU_FPA.
-
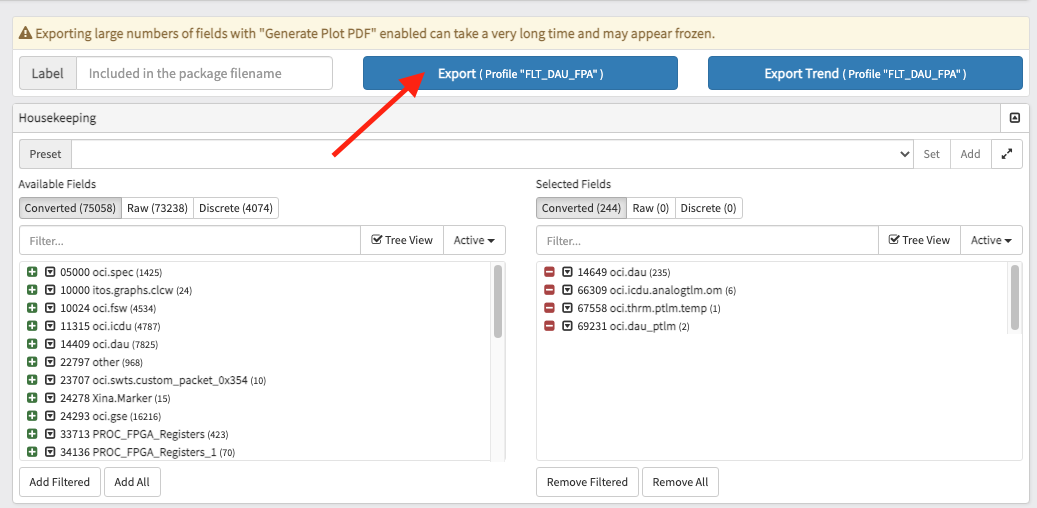
Click on the profile name to select the profile
-
Click the Export button to start the export process
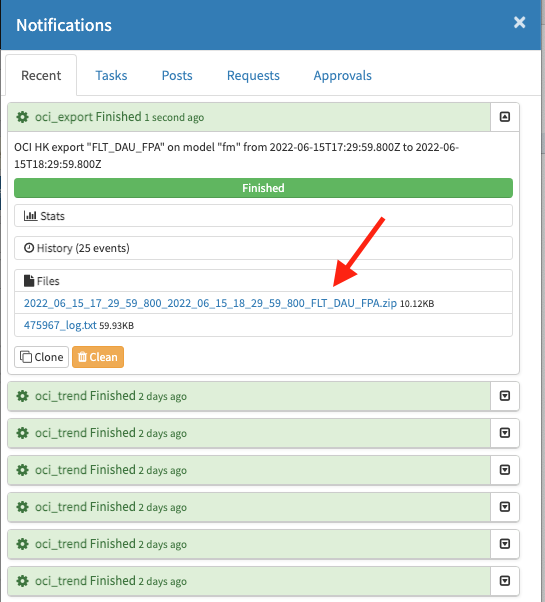
- You can track the status of the export by clicking on the "Notifcations" button in the top right corner. This will open up a side bar that shows your export tasks.
- When the export is finished, you can click on the filename to download it to your computer.
OCI HK Merge Utility
Usage:
java -jar oci_hk_merge.jar
  "<path to legacy export>"
  "<path to fm db.txt>"
  "<path to dau db.txt>"
  "<output file path base>"
  ["<path to force-active db.txt>"]

java -jar xina_import.jar -d output_dir/
If a force-active db file is provided, all fields which are active in that file will be active in the final merged output.
Note that "<output file path base>" is the base name for output files (so C:/out would generate C:/out.tsv, C:/out.json, etc).
Add users to daily reports
These instructions describe how to enable daily reports and add new users. Users will receive a daily email containing links to download the reports they are subscribed to.
- Open a tab to https://oci.xina.io/users. You will use this page to find users' NASA AUIDs, which is what we use to identify and email a user.
- Open a new tab to https://oci.xina.io/tool/oci-hk-export. In the "Profiles" section, find the profile you want to configure and click the expand button to immediately modify a profile. Make sure to click "Save Changes" after editing each field.

- Under "Fields", set "daily" to "True". This enables automated daily reports for this profile.
- Under "Fields", add the "ops_pace" model to the "model" field (if it doesn't already exist). This ensures the automated report is only created for this model instead of all of them.
- Under "Fields", add new users to the "users" field. This is where you will need to use the tab from step 1 to find the user's NASA AUID. Navigate to that tab. Find a user by searching for their name under the "Users" section. Select them. The "User Info" section will display their NASA AUID in parentheses. Use this value when adding new users.
- To enable daily trend reports, follow similar steps on this page https://oci.xina.io/tool/oci-hk-trend-export but do it for the "Trend Profiles" section. For the "models" field, you will need to input a JSON array where each entry is a model. For Example:
[
  "ops_pace"
]
Configure Export Plots
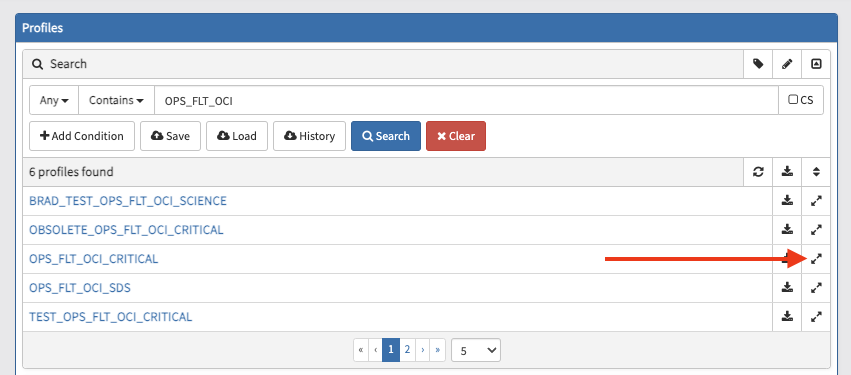
- Find the profile you want to configure and click the expand button to pop up the profile's configuration

- Under the "Fields" section, find and click on "plot". This will pop up the plot configuration.

-
If no plot configuration exists, you can click "Add Default Pages" which will put each mnemonic on its own page and plot. It may take a moment to auto generate a default configuration.
-
Configure as needed. At the moment, configuration is fairly limited.

-
Scroll to the bottom and click "Save Changes".
-
Exit the modal by clicking outside of it or hitting Esc.
-
Reselect the profile to make sure your recent changes are loaded.
Configure Trend Reports
[
  {
    "start": "2024-04-09T18:00:00Z",
    "end": "2030-01-01T00:00:00Z"
  }
]
- If "Enable Interval Conditions" is checked, it will enable trending by intervals/markers.
- By default, the Profile's plot configuration will be used when generating the Trend Report. You can override this by selecting "Enable Custom Plot Configuration" and providing your own JSON Plot Configuration.
- Click "Save Trend Profile" to save your changes. This will create a new Trend Profile if none already exists with the name, otherwise it will overwrite the existing one.
- Click "Export Current Configuration" to export the Trend Profile. You can also export the Trend Profile without saving.