# DraMS XINA Training
# XINA Terminology
**Mnemonics:** A named data channel or field. Example: A temperature sensor or a boolean state
**Model:** A separate system with independent data. Example: Engineering model or flight model
**Events:** A text label for an instance in time or a time interval, aka **Marker**
Example: 01-17-2025 12:32:21 “Started the pump”
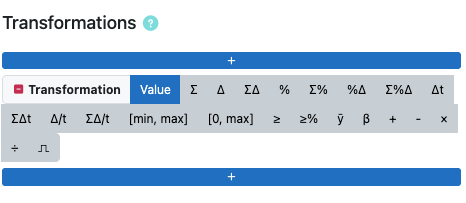
**Transformation** A plot channel that is derived from a mnemonic with some sort of mathematical transformation applied to the mnemonic's values. Example: During TVAC, we might want to see the rate of change of the temperature. We can "transform" a channel to plot the rate of change rather than the absoluate temperature.
**Diagrams:** A Diagram is an SVG image with an accompanying set of rules about how it should change in response to data. Those rules are divided into Switches and Indicators.
**Switches:** A Switch is an on/off logical value. These can be defined as Event Switches, which turn on or off by matching text in Events, Mnemonic Switches, which turn on when a mnemonic is within a specific range, or Logical Switches, which allow you to combine multiple other switches.
**Indicators:** An Indicator associates Switches with visual effects and particular elements in the Diagram image. Indicators can change colors, update text, or apply highlighting.
# Tutorial Videos
Find videos demonstrated common XINA functions, like exporting data, saving frequent plot configuration, setting transformations on mnemonics and much more.
# Exporting To CSV Files
[](https://wiki.xina.io/uploads/images/gallery/2025-11/image-1762369176239.png)
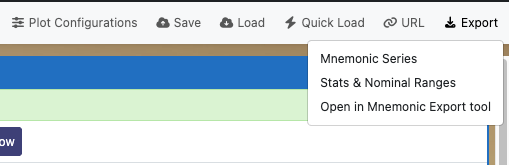
Mnemonic data can be exported to CSV files if you want to do further processing in Excel or other software.
- [Click here for video tutorial on Exporting Mnemonic Data to CSV files](https://smce-xina.s3.us-east-1.amazonaws.com/dist/wiki/Training/Tutorials/DraMS+XINA+Training_+Exporting+and+Viewing+Data.mp4)
- [Click here to open XINA and follow along with video](https://drams.xina.io/tool/mn?conf=WRP%20MOMA%20Nominal%20Values%20Example)
# Saving Your Selections
[](https://wiki.xina.io/uploads/images/gallery/2025-11/image-1762369014667.png)
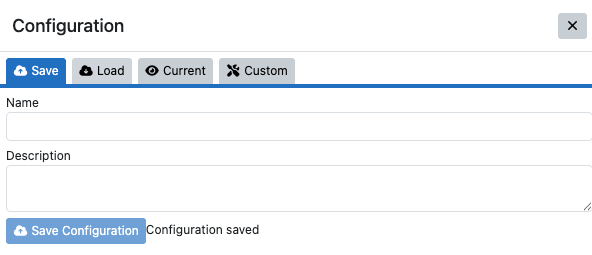
You can save all of your selections in XINA so that you or others can load exactly the configuration you are using.
**[Click here for video tutorial](https://smce-xina.s3.us-east-1.amazonaws.com/dist/wiki/Training/Tutorials/DraMS+XINA+Training_+Saving+and+Loading+Configurations.mp4)**
# Sharing URLs
[](https://wiki.xina.io/uploads/images/gallery/2025-11/image-1762370120303.png)
XINA makes it easy to share what you are looking at in XINA with other users. You can create a URL containing a link to XINA with all the selections you have made (start and end times, mnemonics, plot colors, etc. etc.) You can paste the URLs in emails or other sharing system so other XINA users can look at the exact same view you are seeing.
[Click for video showing how to share a configuration using a URL that you can send to others](https://smce-xina.s3.us-east-1.amazonaws.com/dist/wiki/Training/Tutorials/DraMS+XINA+Training_+URL+Generation+and+Sharing.mp4)
# Use Case: Analyzing Pump Performance Using XINA
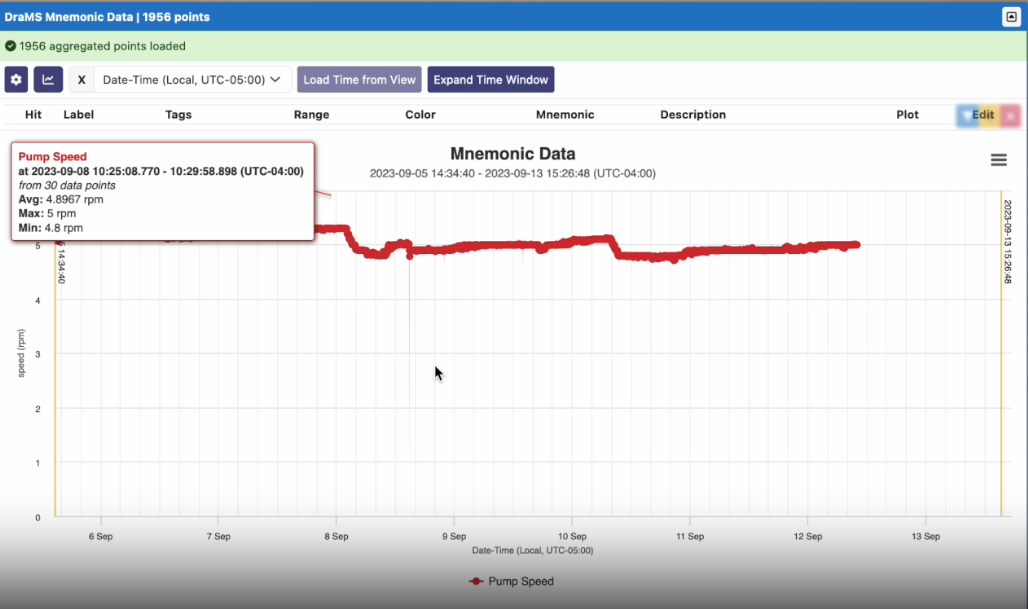
In this video tutorial, we demonstrate a typical use case: using XINA to analyze the performance of the minature scroll pump. This tutorial takes you through the whole process from selecting a time interval, to selecting mnemonics and manipulating the plot views.
[Click for an example of analyzing the performance of the pump using the mnemonic tool](https://smce-xina.s3.us-east-1.amazonaws.com/dist/wiki/Training/Tutorials/DraMS+XINA+Training_+View+Pump+Speed+Data+from+Scroll+Pump+Tests.mp4)
[](https://wiki.xina.io/uploads/images/gallery/2025-11/image-1762370707907.png)
# Use Case: View Most Recent Data from Ongoing Test
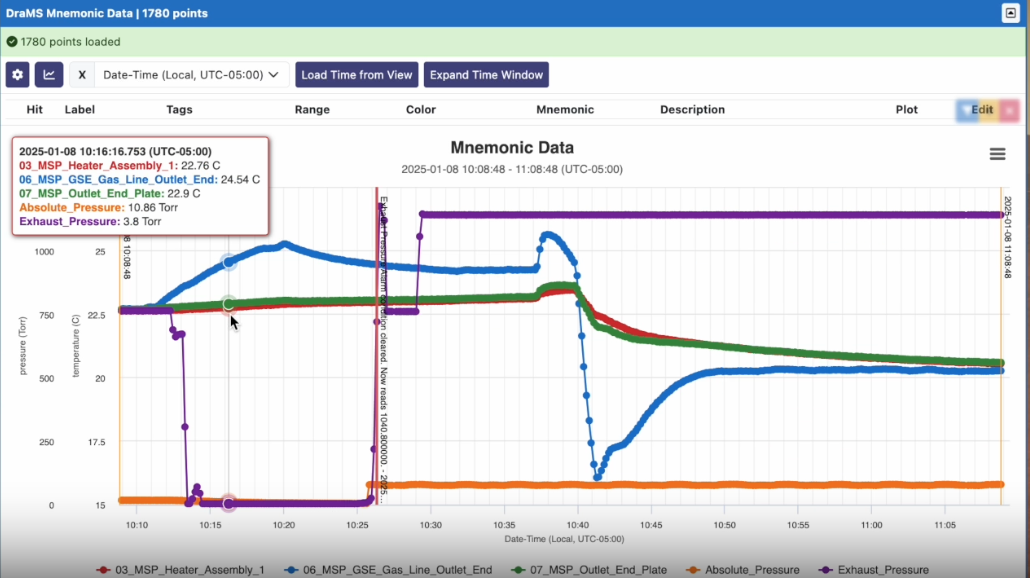
This short video gets you started seleting a data source and a few temperature channels to plot.
[Click for example of viewing the most recent temperature and pressure data from on going testing](https://smce-xina.s3.us-east-1.amazonaws.com/dist/wiki/Training/Tutorials/DraMS+XINA+Training_+View+Recent+Scroll+Pump+Temp+and+Pressure+Data.mp4)
[](https://wiki.xina.io/uploads/images/gallery/2025-11/image-1762370829704.png)
# Transformations: Performing Calculations on Telemetry Data
[](https://wiki.xina.io/uploads/images/gallery/2025-11/image-1762372700599.png)
[Creating copies of mnemonics and making transformation by added a fixed value](https://smce-xina.s3.us-east-1.amazonaws.com/dist/wiki/Training/Tutorials/XINA+DraMS+Mnemonic+Plot+Transformation.m4v)
[Use this link to follow along in XINA](https://drams.xina.io/tool/mn?conf=APV%20FM6%20Adjusted%20Cycle%20Count)
# Dashboard and Real-time Data
This section describes how to use Dashboard to look at real-time data.
# Dashboard and Live Data Introduction
[https://drams.xina.io/tool/dashboard](https://drams.xina.io/tool/dashboard)
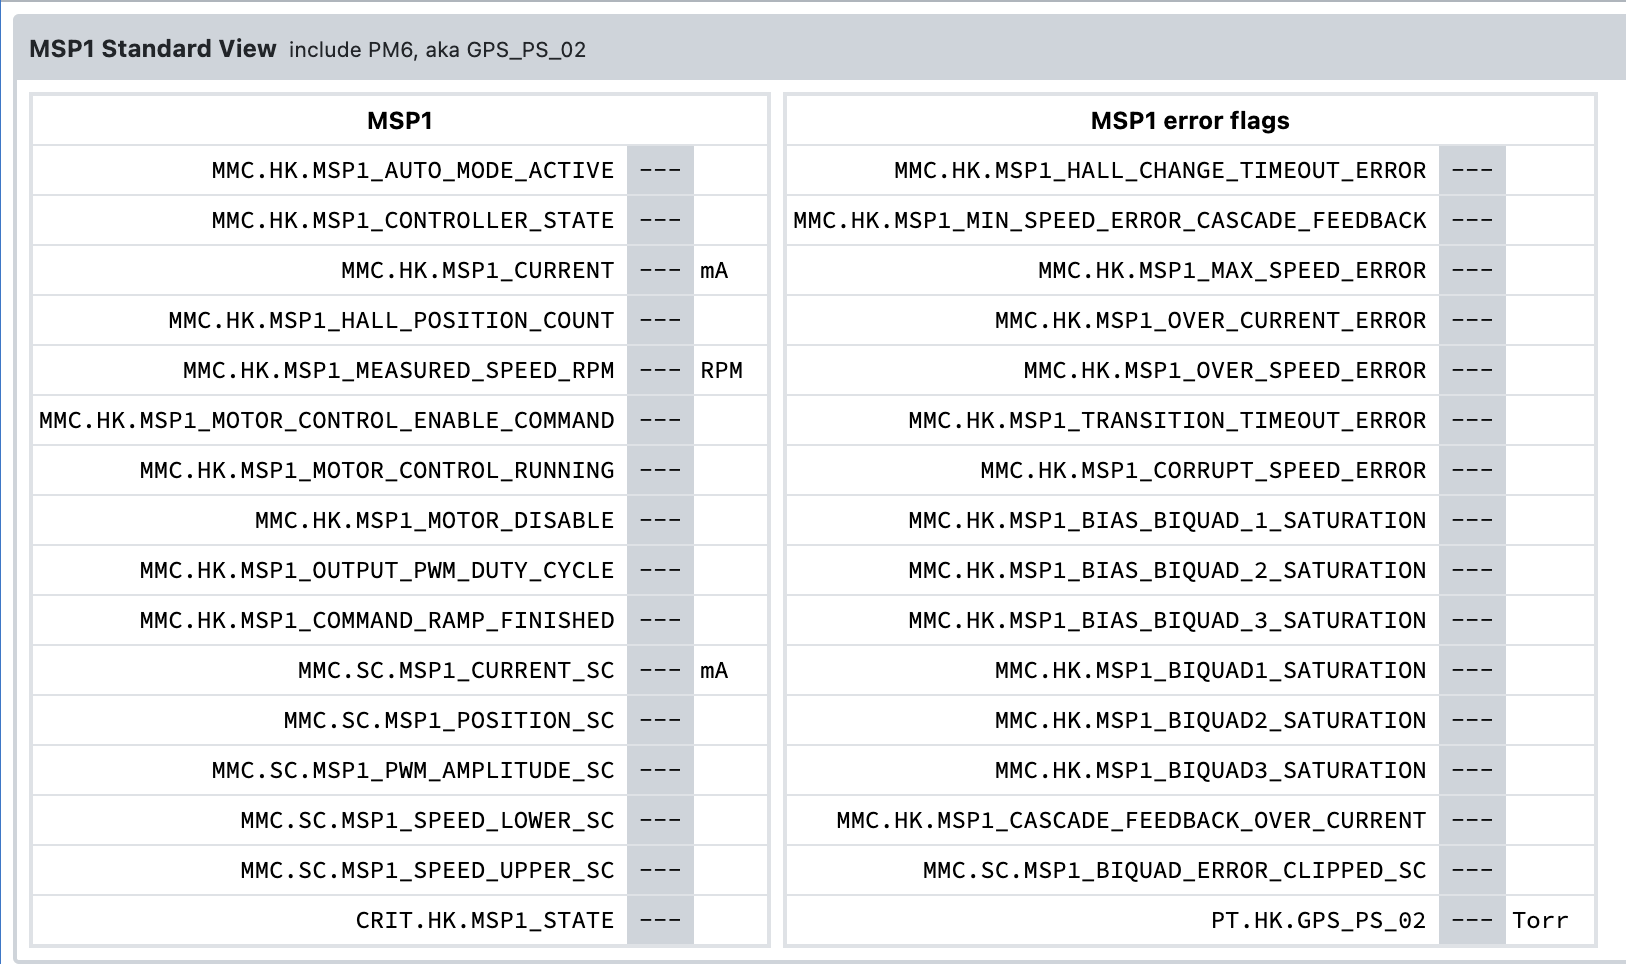
The '''Dashboard''' display was created to display mnemonics in high density format:
[](https://wiki.xina.io/uploads/images/gallery/2026-07/image001.png)
Dashboards were designed around looking at data live -- as it is generated. When data is flowing live, these values will update about every 10 seconds with about a 10 second delay from when they were transmitted out of the instrument. The value displayed is the most recent value.
Dashboards can be configured to have any number of rows and columns containing any DraMS mnemonics.
[https://drams.xina.io/tool/mn](https://drams.xina.io/tool/mn)
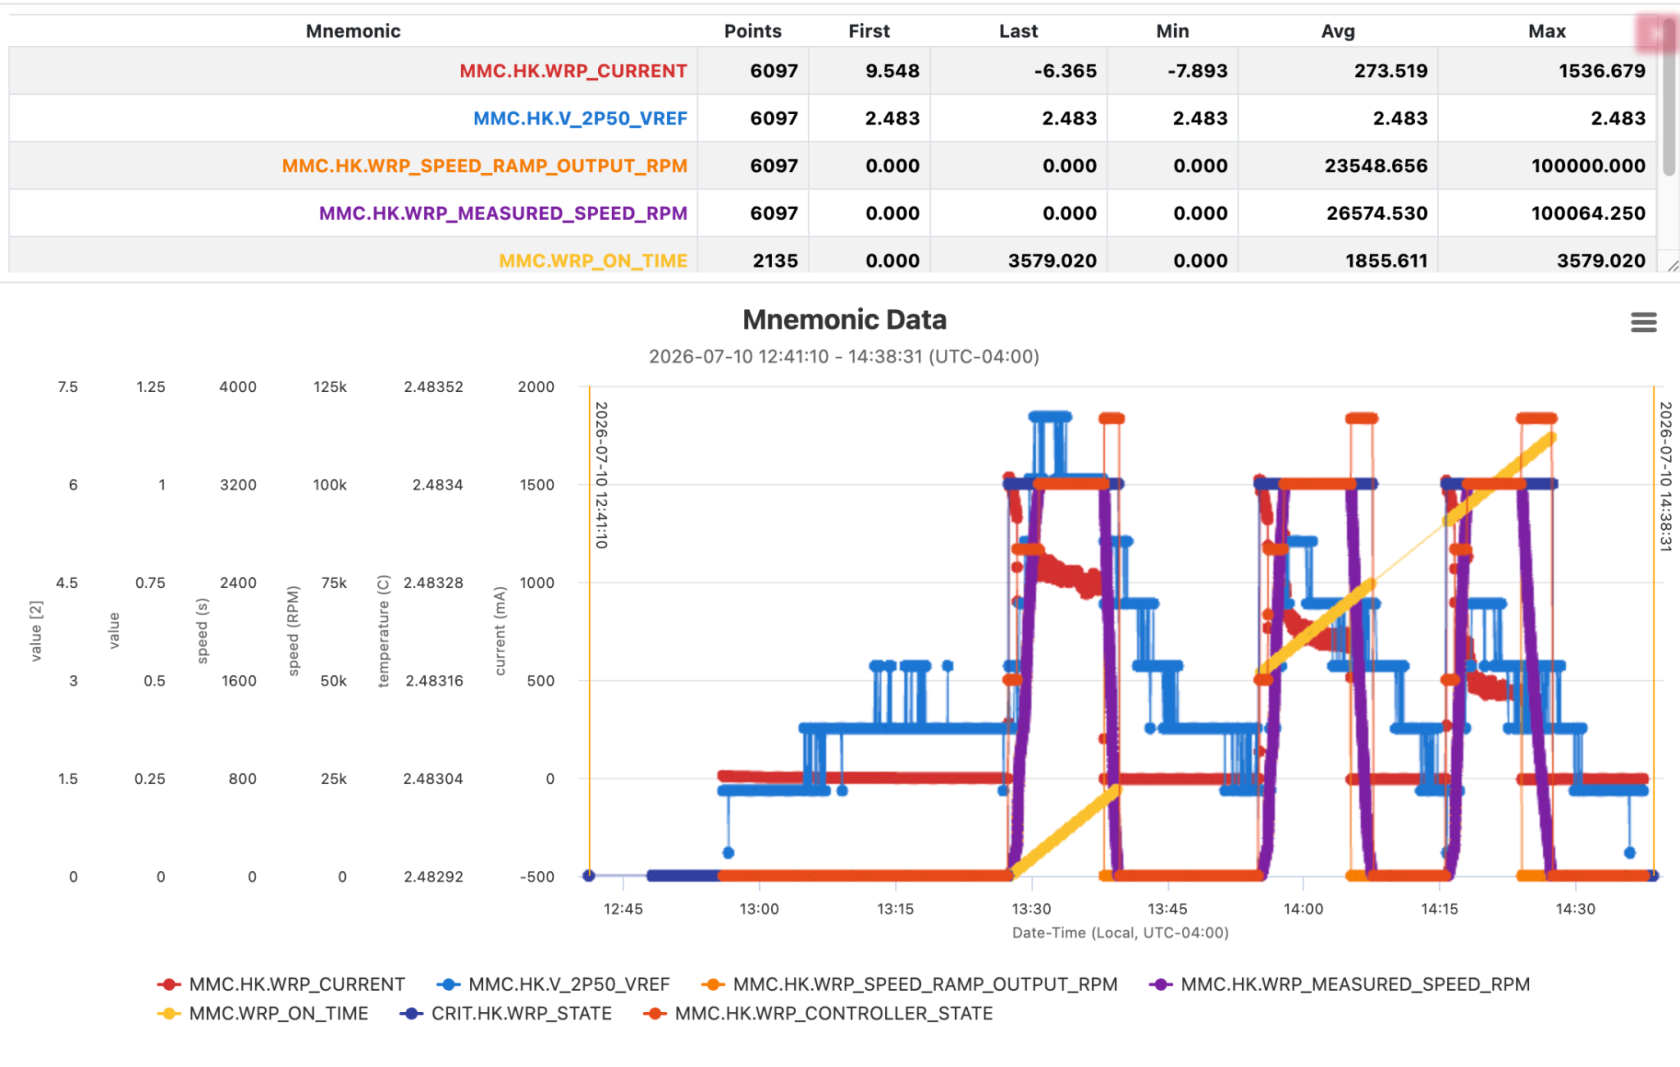
The '''Mnemonic Plot''' tool can be used to plot live data. It can show any combination of mnemonics in a graph as data over time:
[](https://wiki.xina.io/uploads/images/gallery/2026-07/image003.png)
The Mnemonic Plot tool can be configured to update live every 10 seconds like the Dashboard. However, it will plot all the intermediate values that were collected in the last 10 seconds. The Menmonic plot tool can also be used to look at data from any arbitrary date and time range.
[https://drams.xina.io/tool/diagram](https://drams.xina.io/tool/diagram)
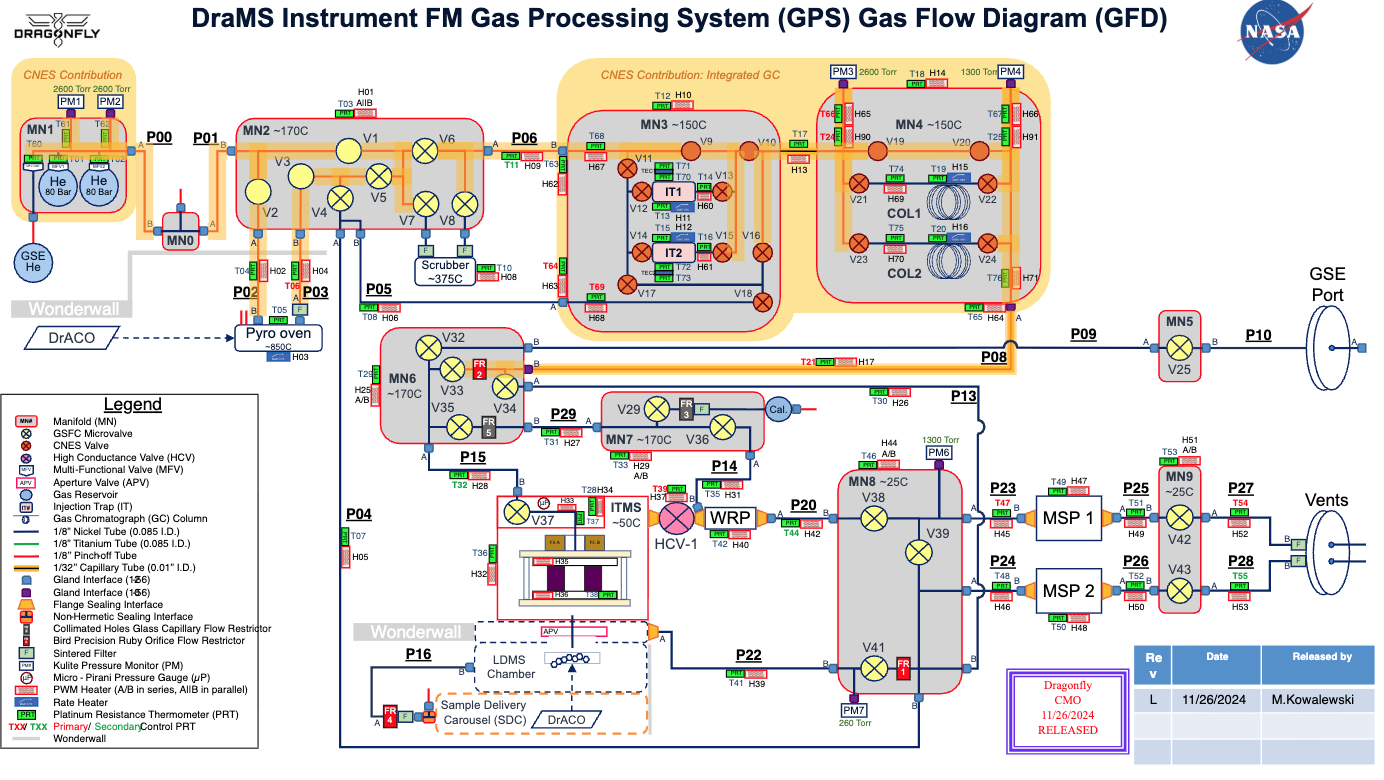
The '''Diagram Tool''' uses the telemetry to update an SVG diagram of the DraMS gas processing system.
[](https://wiki.xina.io/uploads/images/gallery/2026-07/image005.png)
# Dashboard Getting Started
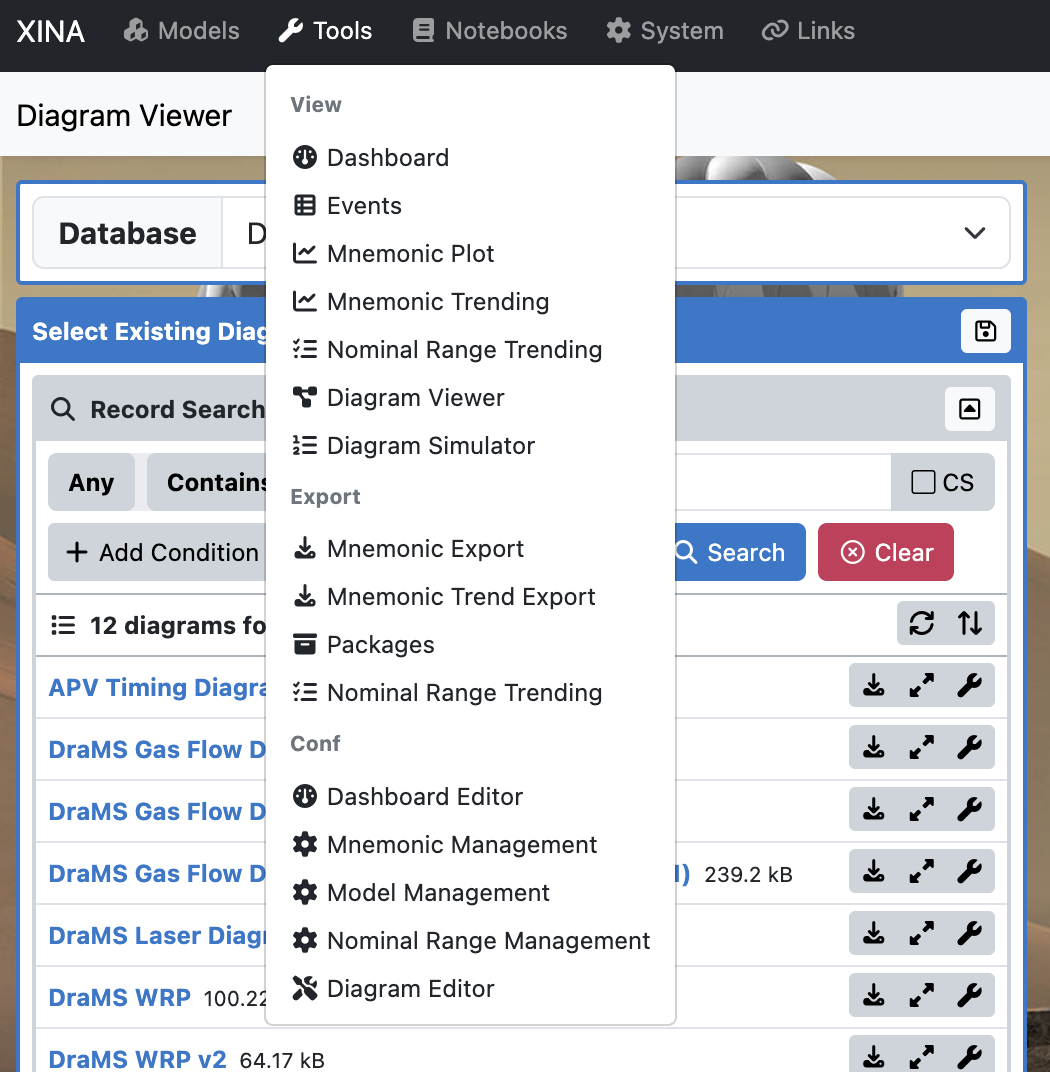
[https://drams.xina.io](https://DraMS.xina.io) has several “tools”. Tools can be select from the Tools menu in the main XINA window. However, URLs can be used to jump directly to particular tools. More on that later. The image below shows the tools menu which can be reached from any XINA screen.
[](https://wiki.xina.io/uploads/images/gallery/2026-07/image007.png)
## Dashboard How-To
The Dashboard has two different XINA tool, the ''[Dashboard](https://drams.xina.io/tool/dashboard)'' (top of the menu) and the ''[Dashboard Editor](https://drams.xina.io/tool/dashboard-editor)'' (near the bottom).
The ''Dashboard'' allows you to select from predefined groups of mnemonics by name, such as “WRP” or “MSP1”.
The ''Dashboard Editor'' allows you to create a new predefined group (referred to as a “Configuration”) of mnemonics or edit an existing group.
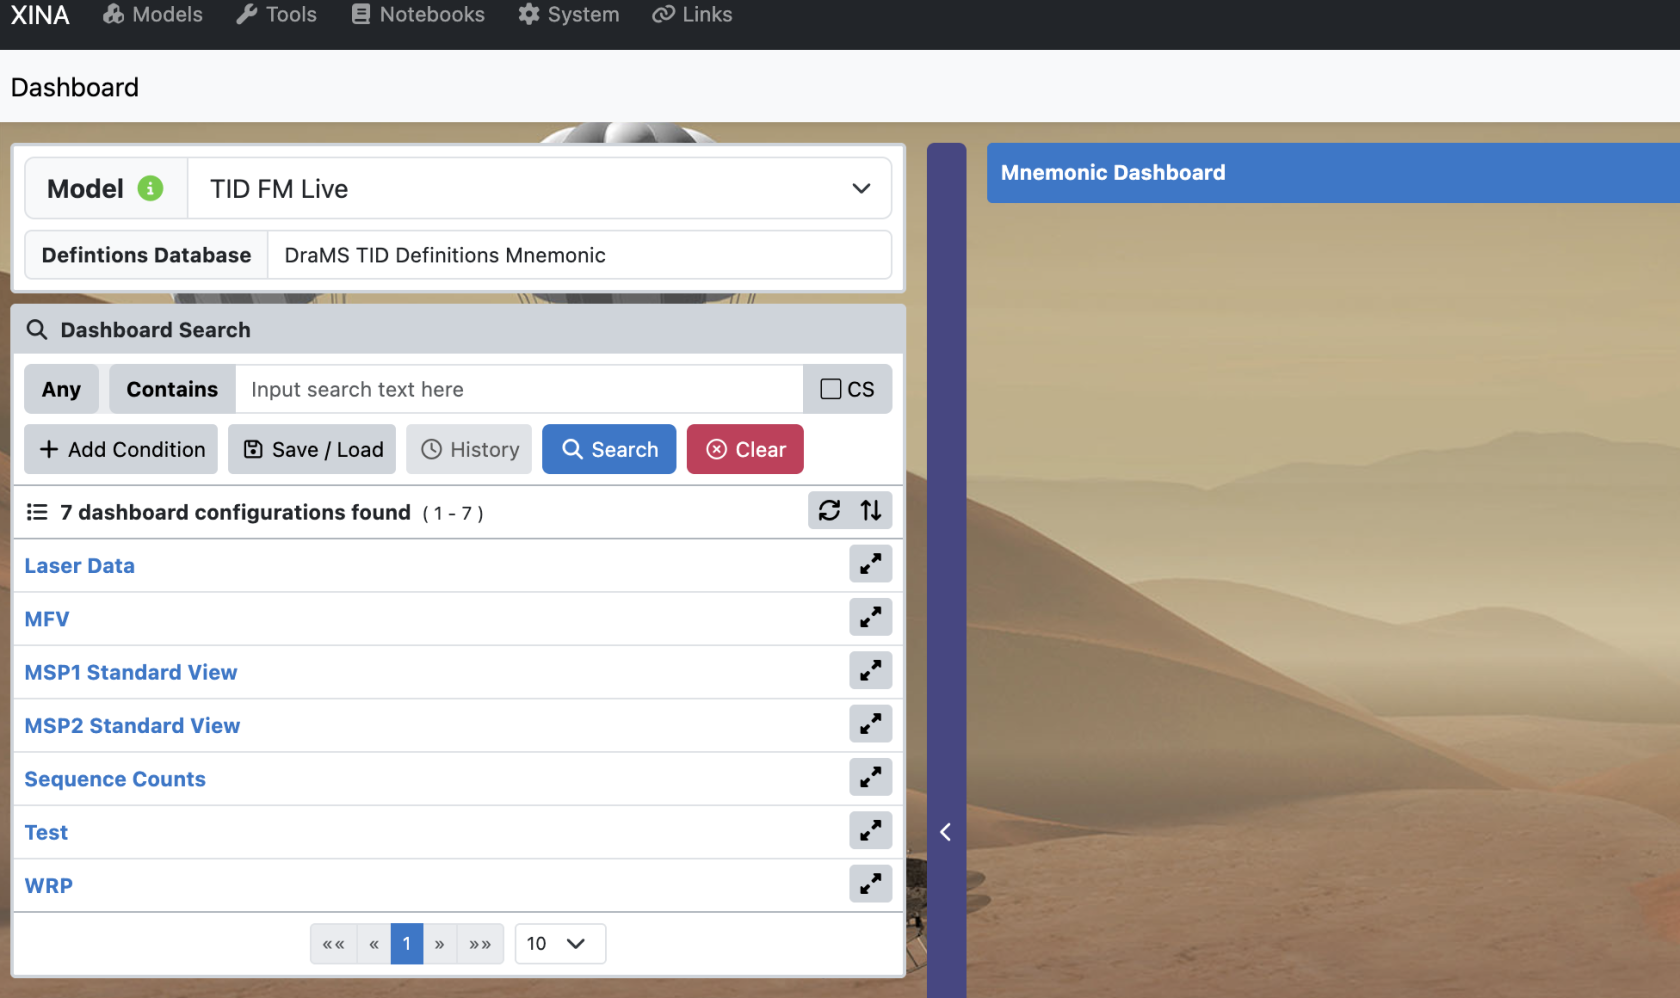
The starting ''Dashboard'' view looks like this (you might see something slightly different):
[](https://wiki.xina.io/uploads/images/gallery/2026-07/image009.png)
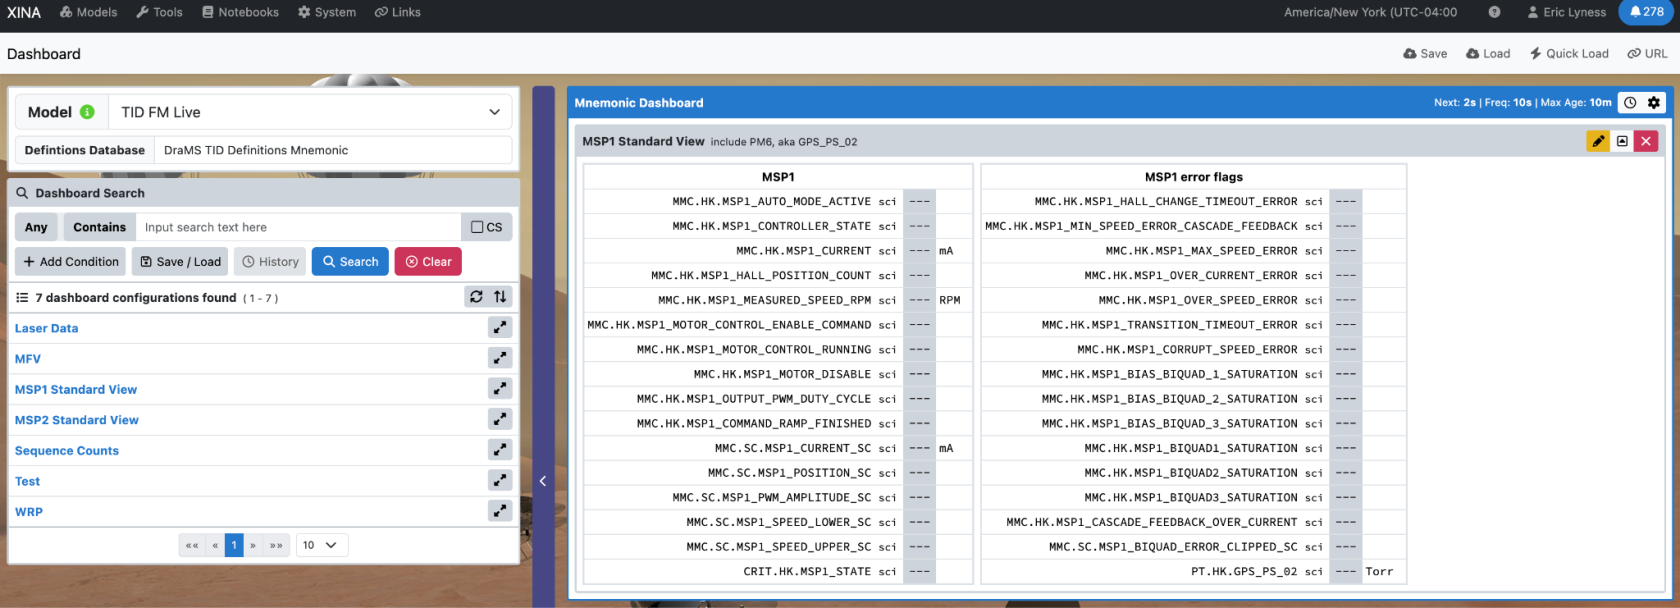
The blue text on the lower left are the names of predefined collections of mnemonics. Clicking one of them will show the table of values. Clicking on “MSP1 Standard View” leads to this view:
[](https://wiki.xina.io/uploads/images/gallery/2026-07/image011.png)
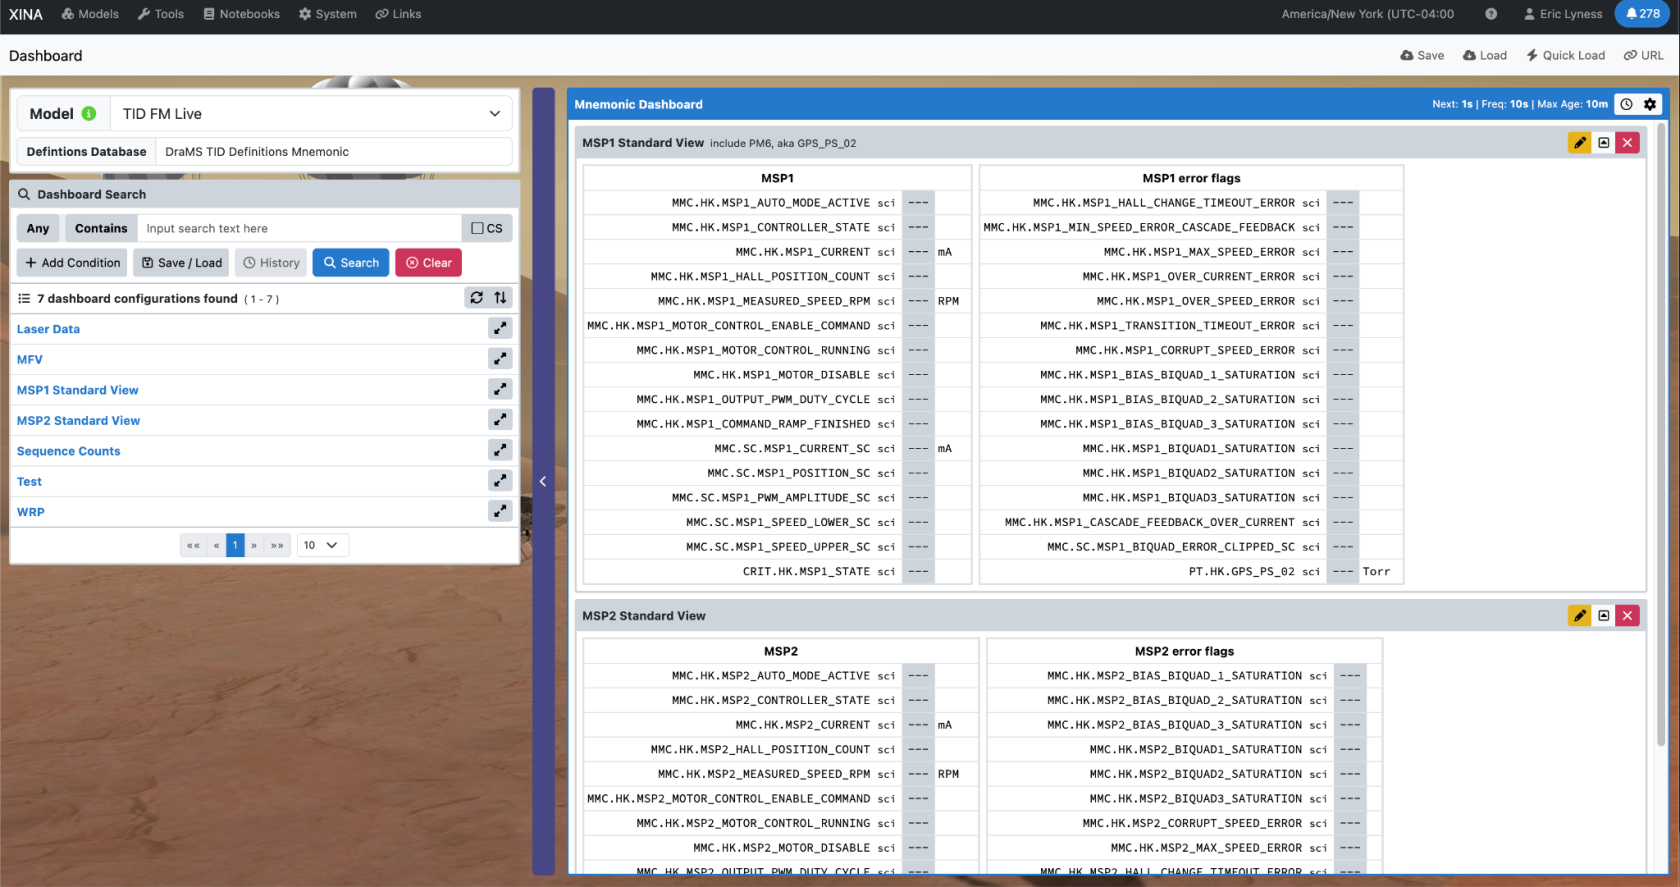
Clicking on another configuration will add a table to the view:
[](https://wiki.xina.io/uploads/images/gallery/2026-07/image013.png)
Each mnemonic can have green, red and yellow ranges defined in XINA. If the mnemonic’s value falls into one of those ranges, the background of the numbers in the table will change to the corresponding color.
# Dashboard: Making URLs and Bookmarks
Your dashboard view can be remembered in XINA and you can save a URL to the dashboard as a bookmark in your browser so that you can very quickly get back to seeing the data.
In the upper right corner of the Dashboard you will see the “Save” and “Load” buttons.
[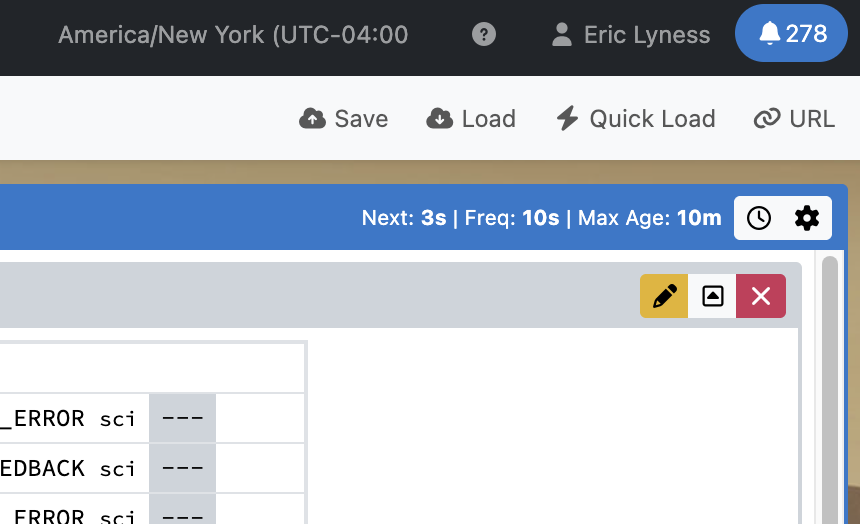](https://wiki.xina.io/uploads/images/gallery/2026-07/image015.png)
The “Save” button allows you to give a name to this Dashboard view and save it in XINA so that you and any other XINA user can find it again.
Clicking save will bring out this view:
[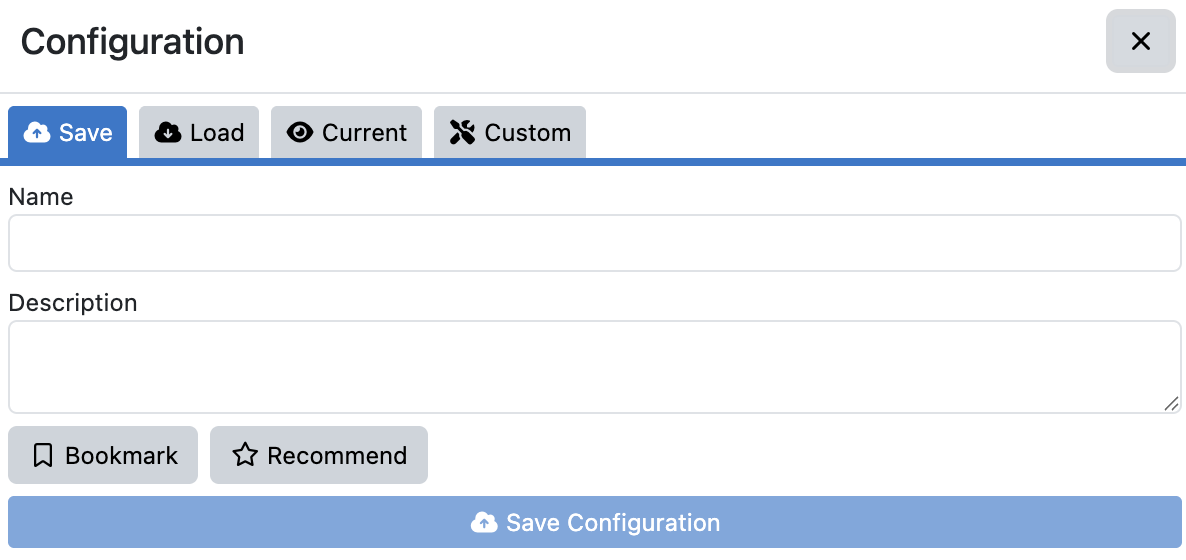](https://wiki.xina.io/uploads/images/gallery/2026-07/image017.png)
Give the dashboard a descriptive name so you can easily find it in a search. There might be many dashboards later. If this is one you use all the time, click “Bookmark” and it will always appear at the top of the search list. Click “Recommend” and other people will also see it at the top of their lists.
Once you’ve saved the Dashboard, you can load it by clicking the “Load” bottom in the top right. You should see something like this:
[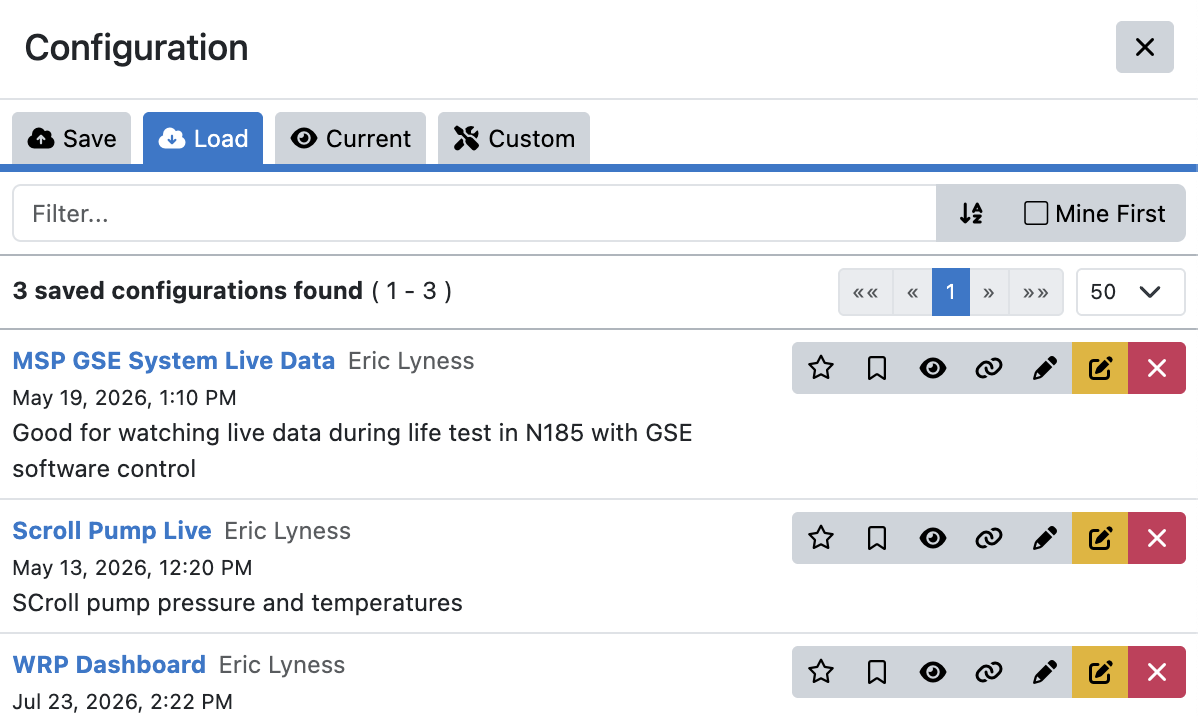](https://wiki.xina.io/uploads/images/gallery/2026-07/image019.png)
Clicking on the blue words, like “Scroll Pump Live” will load the Dashboard view. Notice the set of tools to the right of the name:
[](https://wiki.xina.io/uploads/images/gallery/2026-07/image021.png)
The 4th icon, that looks like a chain link, allows you to create a URL directly to the saved view:
[](https://wiki.xina.io/uploads/images/gallery/2026-07/image024.jpg)
You can copy the link to the clipboard then in your browser, create a new Bookmark and add it to your Bookmarks bar, or wherever is convenient.
The other icons in the row above:
[](https://wiki.xina.io/uploads/images/gallery/2026-07/image025.png)
Make this one of your favorites so it always shows up at the top of your list.
[](https://wiki.xina.io/uploads/images/gallery/2026-07/image027.png)
Recommend this configuration to everyone (it will show up below their favorites)
## Creating Custom Dashboards
[https://drams.xina.io/tool/dashboard-editor](https://drams.xina.io/tool/dashboard-editor)
Use the '''Dashboard Editor''' to create dashboard configs that will appear in the Dashboard view shown above.
[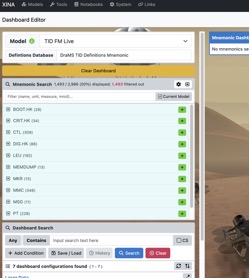](https://wiki.xina.io/uploads/images/gallery/2026-07/image030.jpg)
The top item in the view [](https://wiki.xina.io/uploads/images/gallery/2026-07/image031.png) is important. It determines the database from which the data will come. For the dashboard, always use “TID FM Live”. (other models might be used for specific purposes not covered here).
Also leave the "Definitions Database” as is.
# DraMS Diagram Tool
Videos and presentations using all the aspects of the Diagram Tool
# Diagram Tool Introduction
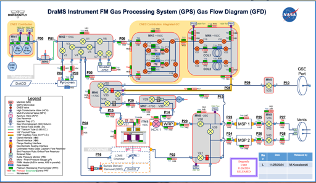
The Diagram Tool allows images to be "animated" based on data in XINA. Typically this is used to view the DraMS Gas Processing System. But any image that can be saved an "SVG" file can setup to be animated. (See below for instructions to make PowerPoint slides into SVG files)
[XINA Link](https://drams.xina.io)
[](https://wiki.xina.io/uploads/images/gallery/2025-11/image-1762178100419.png)
The Diagram Tool is actually 3 tools.
- Diagram Viewer -- Open an existing diagram and select a set of data to animate it
- Diagram Editor -- Create and edit an existing diagram
- Diagram Simulator -- Create scripts to simulate the data and view in the diagram
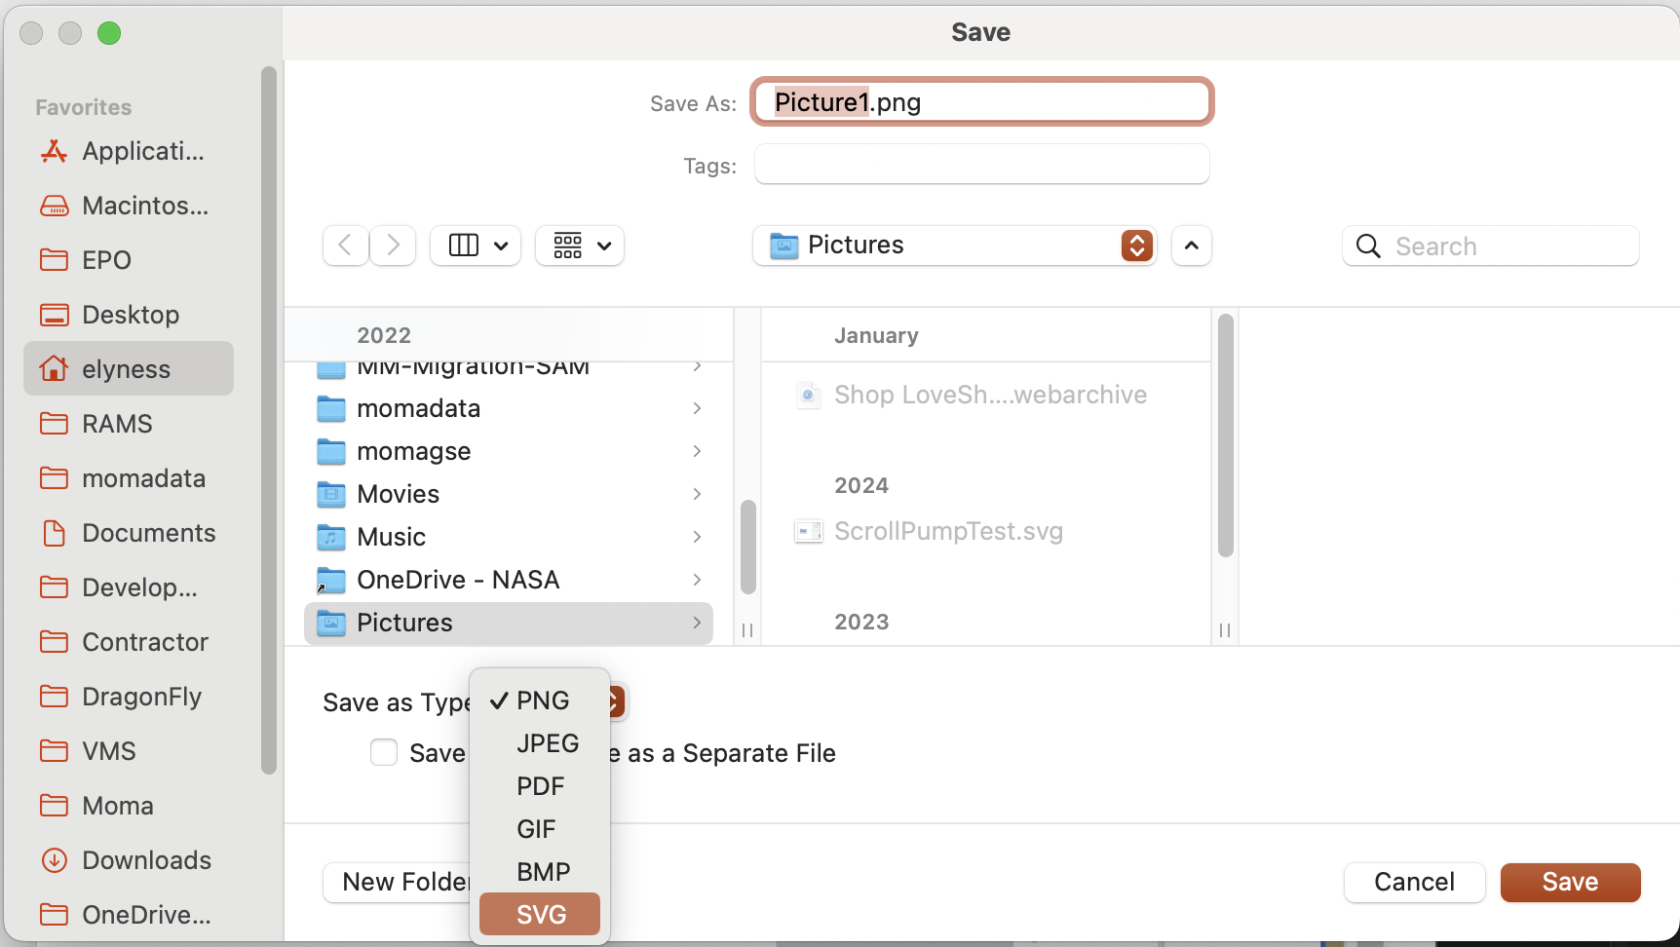
Creating SVG files from PowerPoint: You cannot simply take a screenshot of a slide. To animate an drawing from PowerPoint, the drawing should have a seperate object for each item you want to animate. For instance, in the image above, each valve and each pipe is an object in the PowerPoint slide. Once you have a slide with all of objects (squares, circles, lines, etc.), you can export to SVG. To do this, drag the mouse around the entire slide (or part of the slide you want to export). Then right-click on the slide. From the pop-up menu, select "Save as Picture..." Then in a dialog box that appears, select SVG as the file type.
[](https://wiki.xina.io/uploads/images/gallery/2025-11/image-1762180212840.png)
# Diagram Viewer
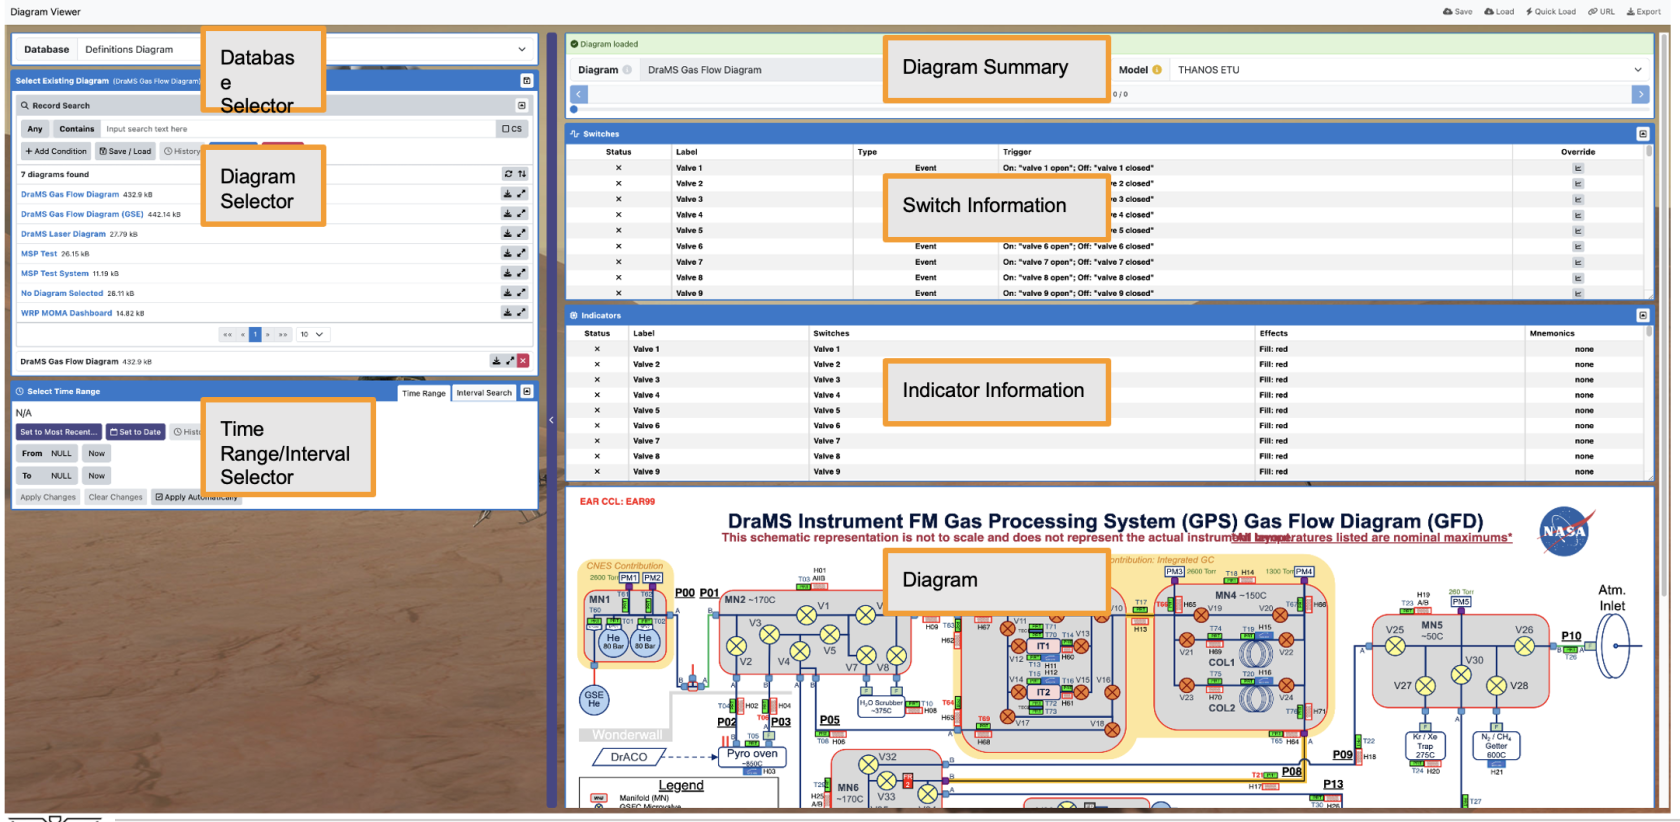
The Diagram Viewer tool brings diagrams and schematics alive by changing diagram attributes, such as color or text, based on telemetry data.
For a video tutorial on using the Diagram Viewer, click [here](https://smce-xina.s3.us-east-1.amazonaws.com/dist/wiki/Training/Diagram+Viewer/DraMS+XINA+Training_+Diagram+Viewer.mp4)
To view the training presentation in PDF form, click [here](https://smce-xina.s3.us-east-1.amazonaws.com/dist/wiki/Training/Diagram+Viewer/DraMS+XINA+Training_+Diagram+Viewer.pdf)
To download the training presentation as a PowerPoint file, click [here](https://smce-xina.s3.us-east-1.amazonaws.com/dist/wiki/Training/Diagram+Viewer/DraMS+XINA+Training_+Diagram+Viewer.pptx)
[](https://wiki.xina.io/uploads/images/gallery/2025-11/image-1762179036080.png)
The file attachment on the left contains a step-by-step description of using the Diagram Viewer.
# Diagram Editor
The Diagram Editor tool allows you to create and manage responsive diagrams and dashboards. While you can view data here, the Diagram Viewer and Diagram Simulator are better suited for that purpose.
For a video tuturial, click [here](https://smce-xina.s3.us-east-1.amazonaws.com/dist/wiki/Training/Diagram+Editor/DraMS+XINA+Training_+Diagram+Editor.mp4)
To download a PDF of a training presentation, click [here](https://smce-xina.s3.us-east-1.amazonaws.com/dist/wiki/Training/Diagram+Editor/DraMS+XINA+Training_+Diagram+Editor.pdf)
To download a PowerPoint of the training materials, click [here](https://smce-xina.s3.us-east-1.amazonaws.com/dist/wiki/Training/Diagram+Editor/DraMS+XINA+Training_+Diagram+Editor.pptx)
The layout of the Diagram Editor is almost identical to the Diagram Viewer, so please refer to the Diagram Viewer tutorial for an introduction.
[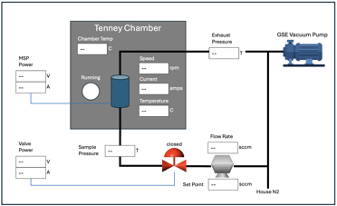](https://wiki.xina.io/uploads/images/gallery/2025-11/image-1762179484008.png)
# Diagram Simulator
The Diagram Simulator tool allows you to view responsive diagrams and dashboards with simulated data in the form of sequence files. For real data, use the Diagram Viewer.
For a video tutorial on the diagram simulator, click [here](https://smce-xina.s3.us-east-1.amazonaws.com/dist/wiki/Training/Diagram+Simulator/DraMS+XINA+Training_+Diagram+Simulator.mp4)
For a PDF of the training presentation, click [here](https://smce-xina.s3.us-east-1.amazonaws.com/dist/wiki/Training/Diagram+Simulator/DraMS+XINA+Training_+Diagram+Simulator.pdf)
To download the training PowerPoint file, click [here](https://smce-xina.s3.us-east-1.amazonaws.com/dist/wiki/Training/Diagram+Simulator/DraMS+XINA+Training_+Diagram+Simulator.pptx)
[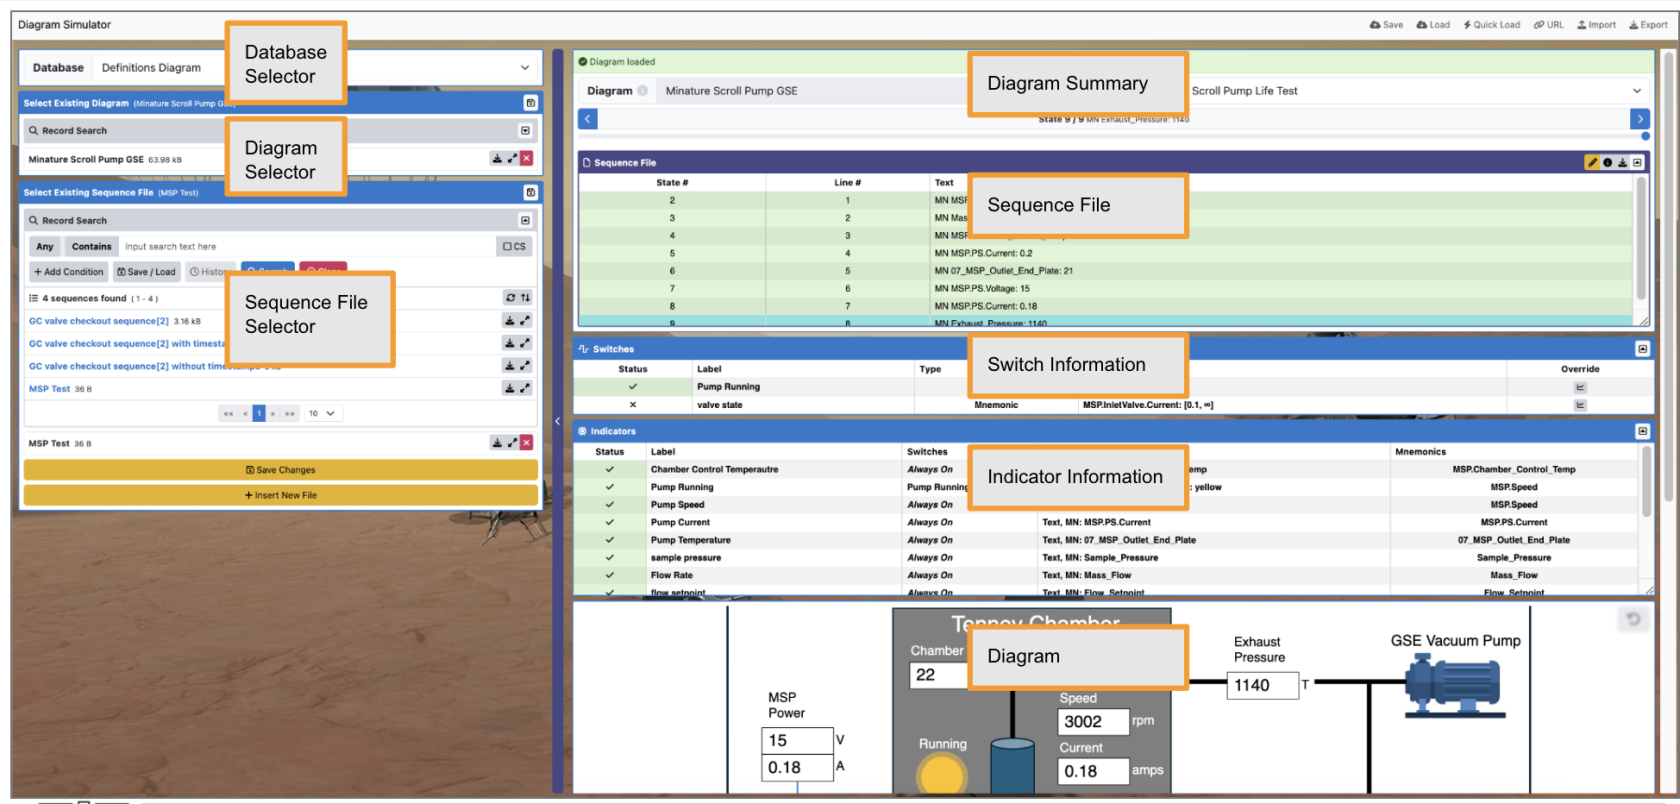](https://wiki.xina.io/uploads/images/gallery/2025-11/image-1762180587301.png)
# Mnemonic Plotting Tool
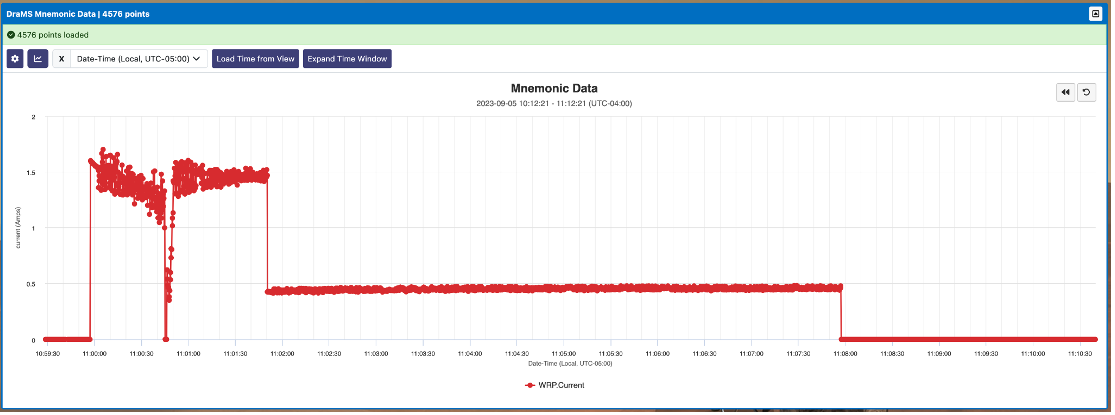
The Mnemonic Plot Tool is useful for looking at mnemonic data, like voltages and temperatures, over time. This chapter contains two presentations, one for basic tool functions and another presentation for advanced functions.
# Getting Started with Mnemonic Plot Tool
Mnemonics, sometimes called "housekeeping value", are simply named telemtry channels contain values over time. Typical mnemonics are voltages and temperature measured at a regular interval by the instrument.
[Click here for a link to the tool](https://drams.xina.io/tool/mn)
[Click here to watch the training video](https://smce-xina.s3.us-east-1.amazonaws.com/dist/wiki/Training/DraMS+XINA+Training_+Mnemonic+Plot+Tool/Mnemonic+Plot+Tool/DraMS+XINA+Training_+Mnemonic+Plot+Tool.mp4)
[Click here to see a PDF of the training materials](https://smce-xina.s3.us-east-1.amazonaws.com/dist/wiki/Training/DraMS+XINA+Training_+Mnemonic+Plot+Tool/Mnemonic+Plot+Tool/DraMS+Mnemonic+Plot+Tool+Training.pdf)
[Click here to download the training materials as a PowerPoint file.](https://smce-xina.s3.us-east-1.amazonaws.com/dist/wiki/Training/DraMS+XINA+Training_+Mnemonic+Plot+Tool/Mnemonic+Plot+Tool/DraMS+Mnemonic+Plot+Tool+Training.pptx)
[](https://wiki.xina.io/uploads/images/gallery/2025-11/image-1762200640387.png)
**Notes about Mnemonics**
Mnemonic names can be anything, but by convention we use a "dot" notation. Using the dot notation, the name of a given telemetry value starts with the subsystem and gets more specific. For instance, for DrAMS, the Multi-Motor Control, aka "MMC", communicates and controls many mechanical systems. The names of the mnemonics for the MMC start with "MMC." followed by mechanical subsystem, followed by other distinguishing names.
Examples:
- mmc.apv.hk...
- mmc.pirani.hk...
- mmc.wrp.hk...
- mmc.msp.hk...
# More Details about the Mnemonic Tool
This tutorial will cover more advanced features present in the Mnemonic Plot tool that were not covered in the base tutorial. These features will allow the user to further refine how data is displayed and include adjusting the binning mode, exploring the various methods of time range selection, and adjusting data thresholds.
[Click here to launch the tool](https://drams.xina.io/tool/mn)
[Click here to watch the tutorial video](https://smce-xina.s3.us-east-1.amazonaws.com/dist/wiki/Training/DraMS+XINA+Training_+Mnemonic+Plot+Tool/Advanced+Mnemonic+Plot+Tool/DraMS+XINA+Training_+Advanced+Mnemonic+Plot+Tool.mp4)
[Click here to open the PDF training manual](https://smce-xina.s3.us-east-1.amazonaws.com/dist/wiki/Training/DraMS+XINA+Training_+Mnemonic+Plot+Tool/Advanced+Mnemonic+Plot+Tool/DraMS+XINA+Training_+Advanced+Mnemonic+Plot+Tool.pdf)
[Click here to download the training as PowerPoint file](https://smce-xina.s3.us-east-1.amazonaws.com/dist/wiki/Training/DraMS+XINA+Training_+Mnemonic+Plot+Tool/Advanced+Mnemonic+Plot+Tool/DraMS+XINA+Training_+Advanced+Mnemonic+Plot+Tool.pptx)
# Events Tool
The DraMS instrument and many subsystems generate logs describing in text what the instrument is doing. These logs can get very long and difficult to sort through. The event tool provides several ways to sort and search the logs messages.
# Events Tool
This tutorial will introduce the DraMS XINA Events tool. This tool simply allows you to easily access the events log from specified time periods/intervals.
[Click here to open the Event Tool](https://drams.xina.io/tool/event)
[Click here to watch the video tutorial](https://smce-xina.s3.us-east-1.amazonaws.com/dist/wiki/Training/DraMS+XINA+Training_+Events+Tool/DraMS+XINA+Training_+Events+Tool.mp4)
[Click here to view a PDF of the training materials](https://smce-xina.s3.us-east-1.amazonaws.com/dist/wiki/Training/DraMS+XINA+Training_+Events+Tool/DraMS+XINA+Training_+Events+Tool.pdf)
[Click here to download the training materials in PowerPoint format](https://smce-xina.s3.us-east-1.amazonaws.com/dist/wiki/Training/DraMS+XINA+Training_+Events+Tool/DraMS+XINA+Training_+Events+Tool.pptx)
# Trending
The Mnemonic Trending Tool is the primary long-term data viewer for DraMS XINA.
This tool allows the user to view trends in data (including science data and engineering data) over the course of selected time intervals, which is especially helpful when looking at data from long tests.
# Getting Started with Mnemonic Trending
In this tutorial, we will be viewing the current (amps) trends over every instance that WRP MOMA was in speed control mode.
[Click here to open the Mnemonic Trend Tool in XINA](https://drams.xina.io/tool/mn-trend)
[Click here to watch the video tutorial](https://smce-xina.s3.us-east-1.amazonaws.com/dist/wiki/Training/DraMS+XINA+Training_+Mnemonic+Trending+Tool/Mnemonic+Trending+Tool/DraMS+XINA+Training_+Mnemonic+Trending+Tool.mp4)
[Click here to view a PDF of the tutorial](https://smce-xina.s3.us-east-1.amazonaws.com/dist/wiki/Training/DraMS+XINA+Training_+Mnemonic+Trending+Tool/Mnemonic+Trending+Tool/DraMS+Mnemonic+Trending+Tool+Training.pdf)
[Click here to download a PowerPoint of the tutorial](https://smce-xina.s3.us-east-1.amazonaws.com/dist/wiki/Training/DraMS+XINA+Training_+Mnemonic+Trending+Tool/Mnemonic+Trending+Tool/DraMS+Mnemonic+Trending+Tool+Training.pptx)
# Advanced Mnemonic Trending
This tutorial will cover more advanced features present in the Mnemonic Trending tool that were not covered in the base tutorial. These features will allow the user to further refine how data is displayed and include changing the shape of the data points, adjusting the data thresholds, and more.
Trending Tool
[Click here to watch the video tutorial](https://smce-xina.s3.us-east-1.amazonaws.com/dist/wiki/Training/DraMS+XINA+Training_+Mnemonic+Trending+Tool/Advanced+Mnemonic+Trending+Tool/DraMS+XINA+Training_+Advanced+Mnemonic+Trending+Tool.mp4)
[Click here to view a PDF of the tutorial](https://smce-xina.s3.us-east-1.amazonaws.com/dist/wiki/Training/DraMS+XINA+Training_+Mnemonic+Trending+Tool/Advanced+Mnemonic+Trending+Tool/DraMS+XINA+Training_+Advanced+Mnemonic+Trending+Tool.pdf)
[Click here to download a PowerPoint of the tutorial](https://smce-xina.s3.us-east-1.amazonaws.com/dist/wiki/Training/DraMS+XINA+Training_+Mnemonic+Trending+Tool/Advanced+Mnemonic+Trending+Tool/DraMS+XINA+Training_+Advanced+Mnemonic+Trending+Tool.pptx)
# Nominal Ranges
The Nominal Range Trending Tool provides a way to track if a given mnemonic value at a particular time interval is inside a desired range (green range), outside of a desired range (red range), or in a range that is anomalous but not necessarily dangerous (yellow).
# Nominal Range Tool
The Nominal Range Trending Tool provides a way to track if a given mnemonic value at a particular time interval is inside a desired range (green range), outside of a desired range (red range), or in a range that is anomalous but not necessarily dangerous (yellow).
Nominal Range Trending Tool
[Click here to watch the video tutorial](https://smce-xina.s3.us-east-1.amazonaws.com/dist/wiki/Training/DraMS+XINA+Training_+Nominal+Range+Trending+Tool/DraMS+XINA+Training_+Nominal+Range+Trending+Tool.mp4)
[Click here to view a PDF of the tutorial](https://smce-xina.s3.us-east-1.amazonaws.com/dist/wiki/Training/DraMS+XINA+Training_+Nominal+Range+Trending+Tool/DraMS+XINA+Training_+Nominal+Range+Trending+Tool.pdf)
[Click here to download a PowerPoint of the tutorial](https://smce-xina.s3.us-east-1.amazonaws.com/dist/wiki/Training/DraMS+XINA+Training_+Nominal+Range+Trending+Tool/DraMS+XINA+Training_+Nominal+Range+Trending+Tool.pptx)
# Managing Nominal Ranges
The DraMS Nominal Range Management Tool allows the user to add, remove, and update nominal ranges for each available mnemonic. It allows you to designate ranges where the mnemonic value is inside a desired range (green range) or outside of a desired range (red range) or in a range that is anomalous but not necessarily dangerous (yellow).
Trending Tool
[Click here to watch the video tutorial](https://smce-xina.s3.us-east-1.amazonaws.com/dist/wiki/Training/DraMS+XINA+Training_+Nominal+Range+Management+Tool/DraMS+XINA+Training_+Nominal+Range+Management+Tool.mp4)
[Click here to view a PDF of the tutorial](https://smce-xina.s3.us-east-1.amazonaws.com/dist/wiki/Training/DraMS+XINA+Training_+Nominal+Range+Management+Tool/DraMS+XINA+Training_+Nominal+Range+Management+Tool.pdf)
[Click here to download a PowerPoint of the tutorial](https://smce-xina.s3.us-east-1.amazonaws.com/dist/wiki/Training/DraMS+XINA+Training_+Nominal+Range+Management+Tool/DraMS+XINA+Training_+Nominal+Range+Management+Tool.pptx)
# Tutorial Videos
### How-to tutorials covering various XINA capabilities.
---
Mnemonic data can be exported to CSV files if you want to do further processing in Excel or other software.
[Exporting Mnemonic Data to CSV files](https://smce-xina.s3.us-east-1.amazonaws.com/dist/wiki/Training/Tutorials/DraMS+XINA+Training_+Exporting+and+Viewing+Data.mp4)
[Click here to open XINA and follow along with video](https://drams.xina.io/tool/mn?conf=WRP%20MOMA%20Nominal%20Values%20Example)
---
[Saving a tool configuration so others can load exactly what the view you have](https://smce-xina.s3.us-east-1.amazonaws.com/dist/wiki/Training/Tutorials/DraMS+XINA+Training_+Saving+and+Loading+Configurations.mp4)
[Sharing a configuration using a URL that you can send to others](https://smce-xina.s3.us-east-1.amazonaws.com/dist/wiki/Training/Tutorials/DraMS+XINA+Training_+URL+Generation+and+Sharing.mp4)
[Example of analyzing the performance of the pump using the mnemonic tool](https://smce-xina.s3.us-east-1.amazonaws.com/dist/wiki/Training/Tutorials/DraMS+XINA+Training_+View+Pump+Speed+Data+from+Scroll+Pump+Tests.mp4)
[Example of viewing the most recent temperature and pressure data from on going testing](https://smce-xina.s3.us-east-1.amazonaws.com/dist/wiki/Training/Tutorials/DraMS+XINA+Training_+View+Recent+Scroll+Pump+Temp+and+Pressure+Data.mp4)
[Creating copies of mnemonics and making transformation by added a fixed value](https://smce-xina.s3.us-east-1.amazonaws.com/dist/wiki/Training/Tutorials/XINA+DraMS+Mnemonic+Plot+Transformation.m4v)
[Use this link to follow along](https://drams.xina.io/tool/mn?conf=APV%20FM6%20Adjusted%20Cycle%20Count)