DraMS Diagram Tool
Videos and presentations using all the aspects of the Diagram Tool
Diagram Tool Introduction
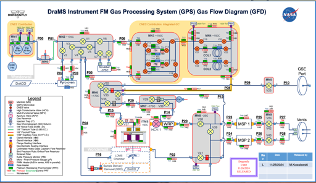
The Diagram Tool allows images to be "animated" based on data in XINA. Typically this is used to view the DraMS Gas Processing System. But any image that can be saved an "SVG" file can setup to be animated. (See below for instructions to make PowerPoint slides into SVG files)
The Diagram Tool is actually 3 tools.
- Diagram Viewer -- Open an existing diagram and select a set of data to animate it
- Diagram Editor -- Create and edit an existing diagram
- Diagram Simulator -- Create scripts to simulate the data and view in the diagram
Creating SVG files from PowerPoint: You cannot simply take a screenshot of a slide. To animate an drawing from PowerPoint, the drawing should have a seperate object for each item you want to animate. For instance, in the image above, each valve and each pipe is an object in the PowerPoint slide. Once you have a slide with all of objects (squares, circles, lines, etc.), you can export to SVG. To do this, drag the mouse around the entire slide (or part of the slide you want to export). Then right-click on the slide. From the pop-up menu, select "Save as Picture..." Then in a dialog box that appears, select SVG as the file type.
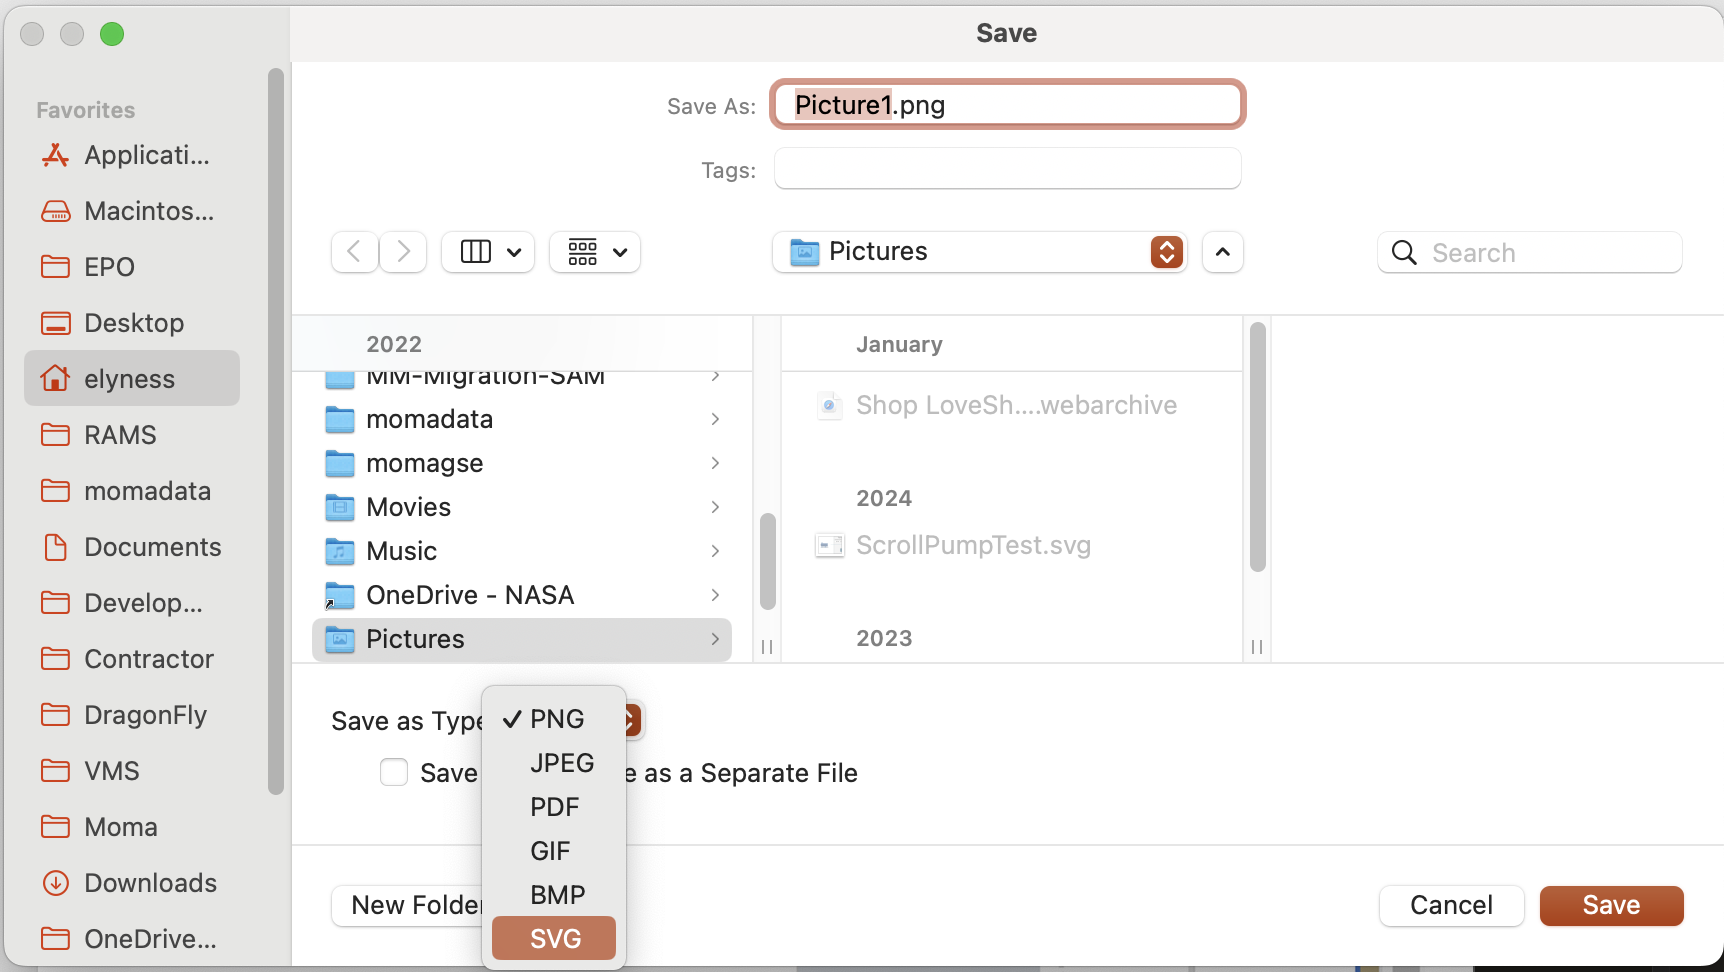
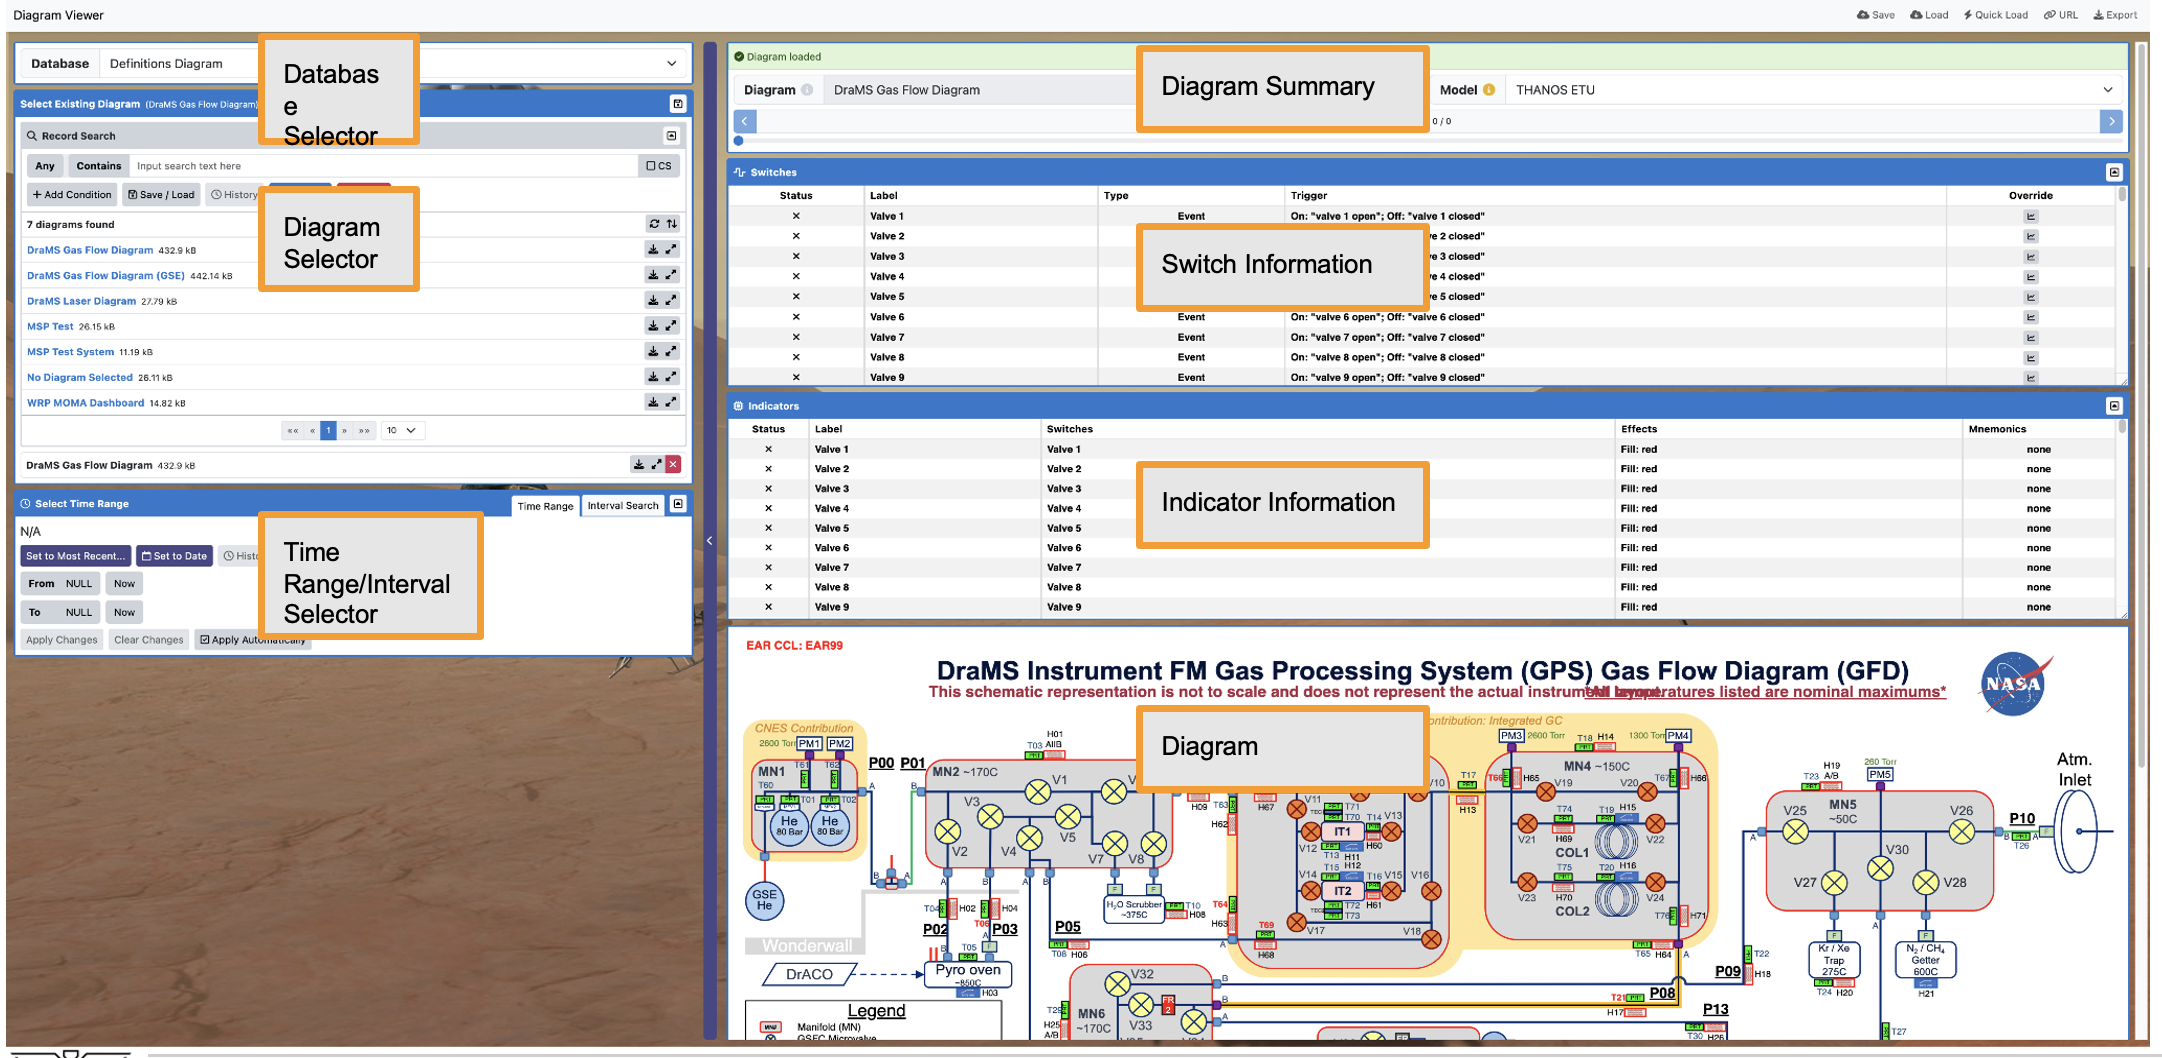
Diagram Viewer
The Diagram Viewer tool brings diagrams and schematics alive by changing diagram attributes, such as color or text, based on telemetry data.
For a video tutorial on using the Diagram Viewer, click here
To view the training presentation in PDF form, click here
To download the training presentation as a PowerPoint file, click here
The file attachment on the left contains a step-by-step description of using the Diagram Viewer.
Diagram Editor
The Diagram Editor tool allows you to create and manage responsive diagrams and dashboards. While you can view data here, the Diagram Viewer and Diagram Simulator are better suited for that purpose.
For a video tuturial, click here
To download a PDF of a training presentation, click here
To download a PowerPoint of the training materials, click here
The layout of the Diagram Editor is almost identical to the Diagram Viewer, so please refer to the Diagram Viewer tutorial for an introduction.
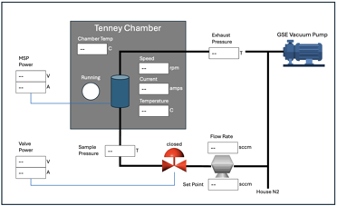
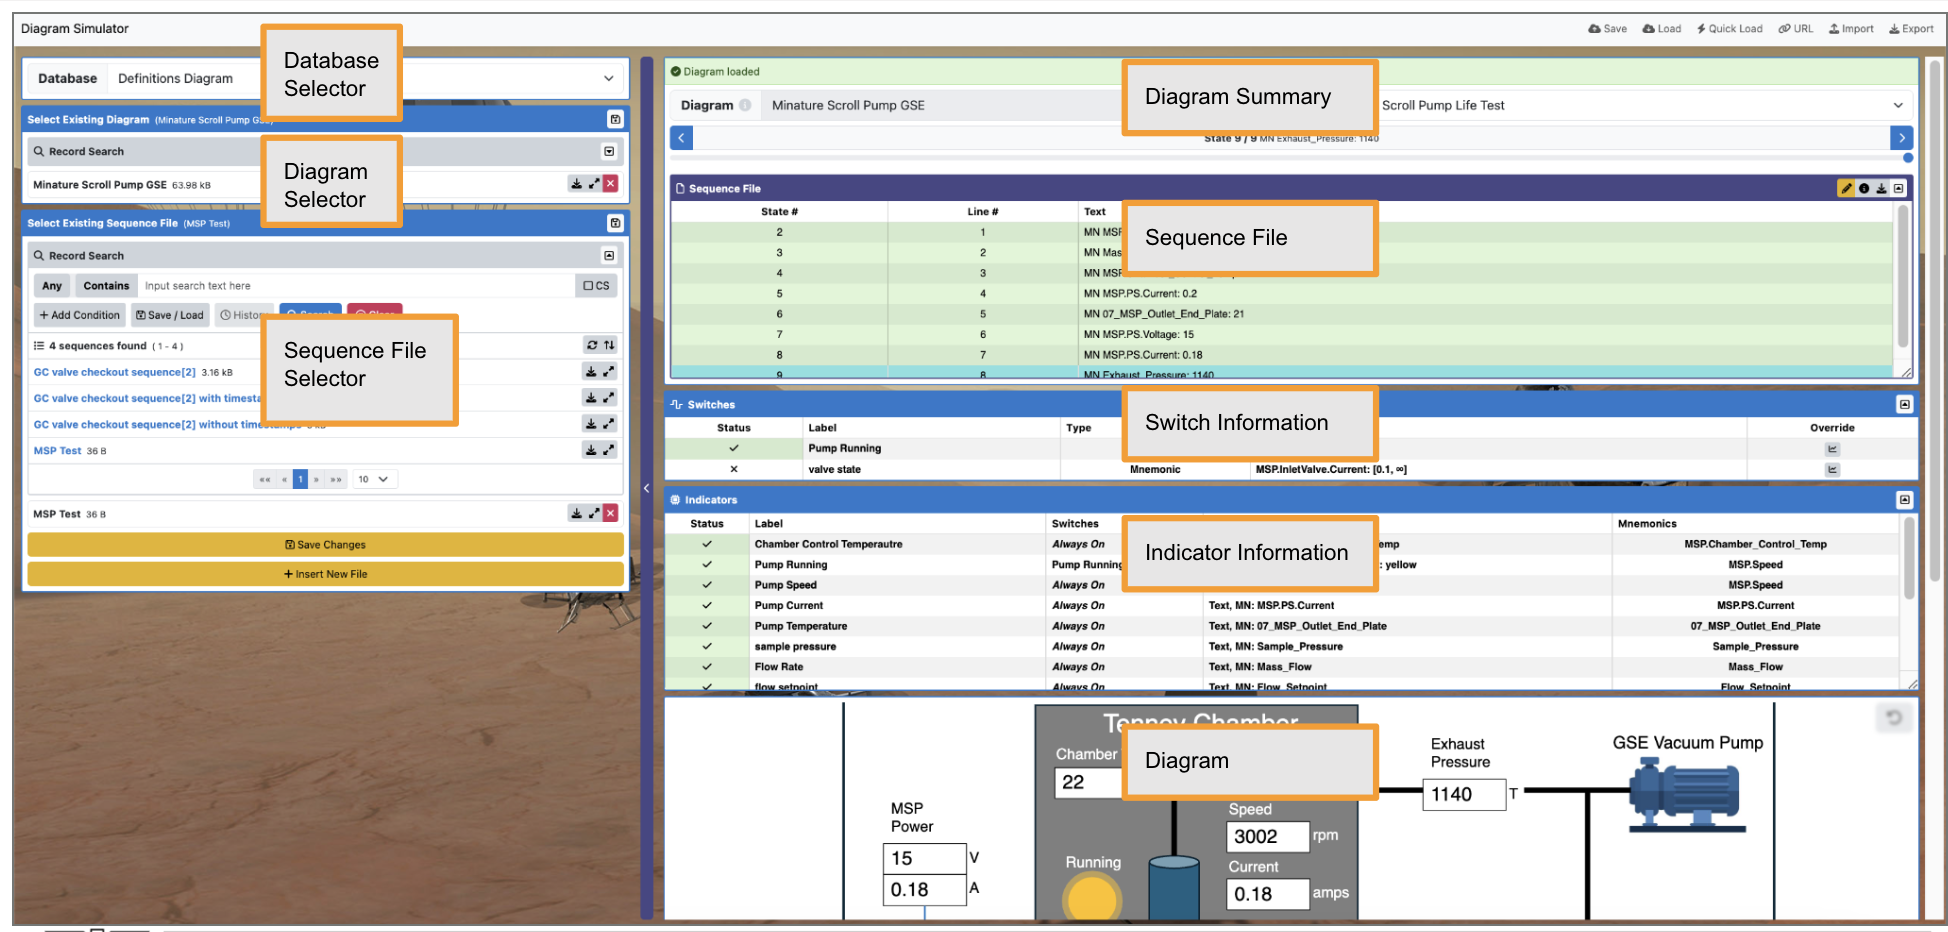
Diagram Simulator
The Diagram Simulator tool allows you to view responsive diagrams and dashboards with simulated data in the form of sequence files. For real data, use the Diagram Viewer.
For a video tutorial on the diagram simulator, click here
For a PDF of the training presentation, click here
To download the training PowerPoint file, click here